UK Property Risk Index
In an ever-changing climate and security landscape, understanding the risks facing property in the UK has never been more important.
17.09.25

This property risk report draws on the latest data to highlight regional and national trends in burglary, criminal damage, arson, subsidence, flooding, and heat damage, offering a clear picture of where these risks are most prevalent. From urban centres to rural landscapes, the UK Property Risk Index from Alan Boswell Group sheds light on the hidden vulnerabilities that can affect a property’s safety, value, and insurability.
UK Property Risk Index - The facts you need to know
Burglary offences are expected to reach 195,427 a year by 2030-31, according to forecasting by Alan Boswell Group.
Insurers paid out £153 million in subsidence-related claims in the first half of 2025.
Six of the English and Welsh areas with the highest burglary rates are in London, while none of the top ten areas for criminal damage and arson offences are in the capital.
Nearly seven in ten (69%) burglaries occur during the week.
A quarter of arson (24%) offences occur during the early evening.
Less than a third (28.8%) of properties are fitted with a burglar alarm.
The majority (69%) of criminal damage is committed against dwellings, rather than non-dwelling buildings.
The number of properties in high-risk coastal and river flood areas facing more than 60cm of flooding could nearly double by mid-century (2036-2069), to 163,200.
Over a tenth (12.6%) of London properties face a medium-to-high risk of surface flooding.
Nearly one in 20 (4.6%) properties in the East Midlands are at medium-to-high risk of river and coastal flooding.
Property crime statistics
Number of burglaries recorded each year
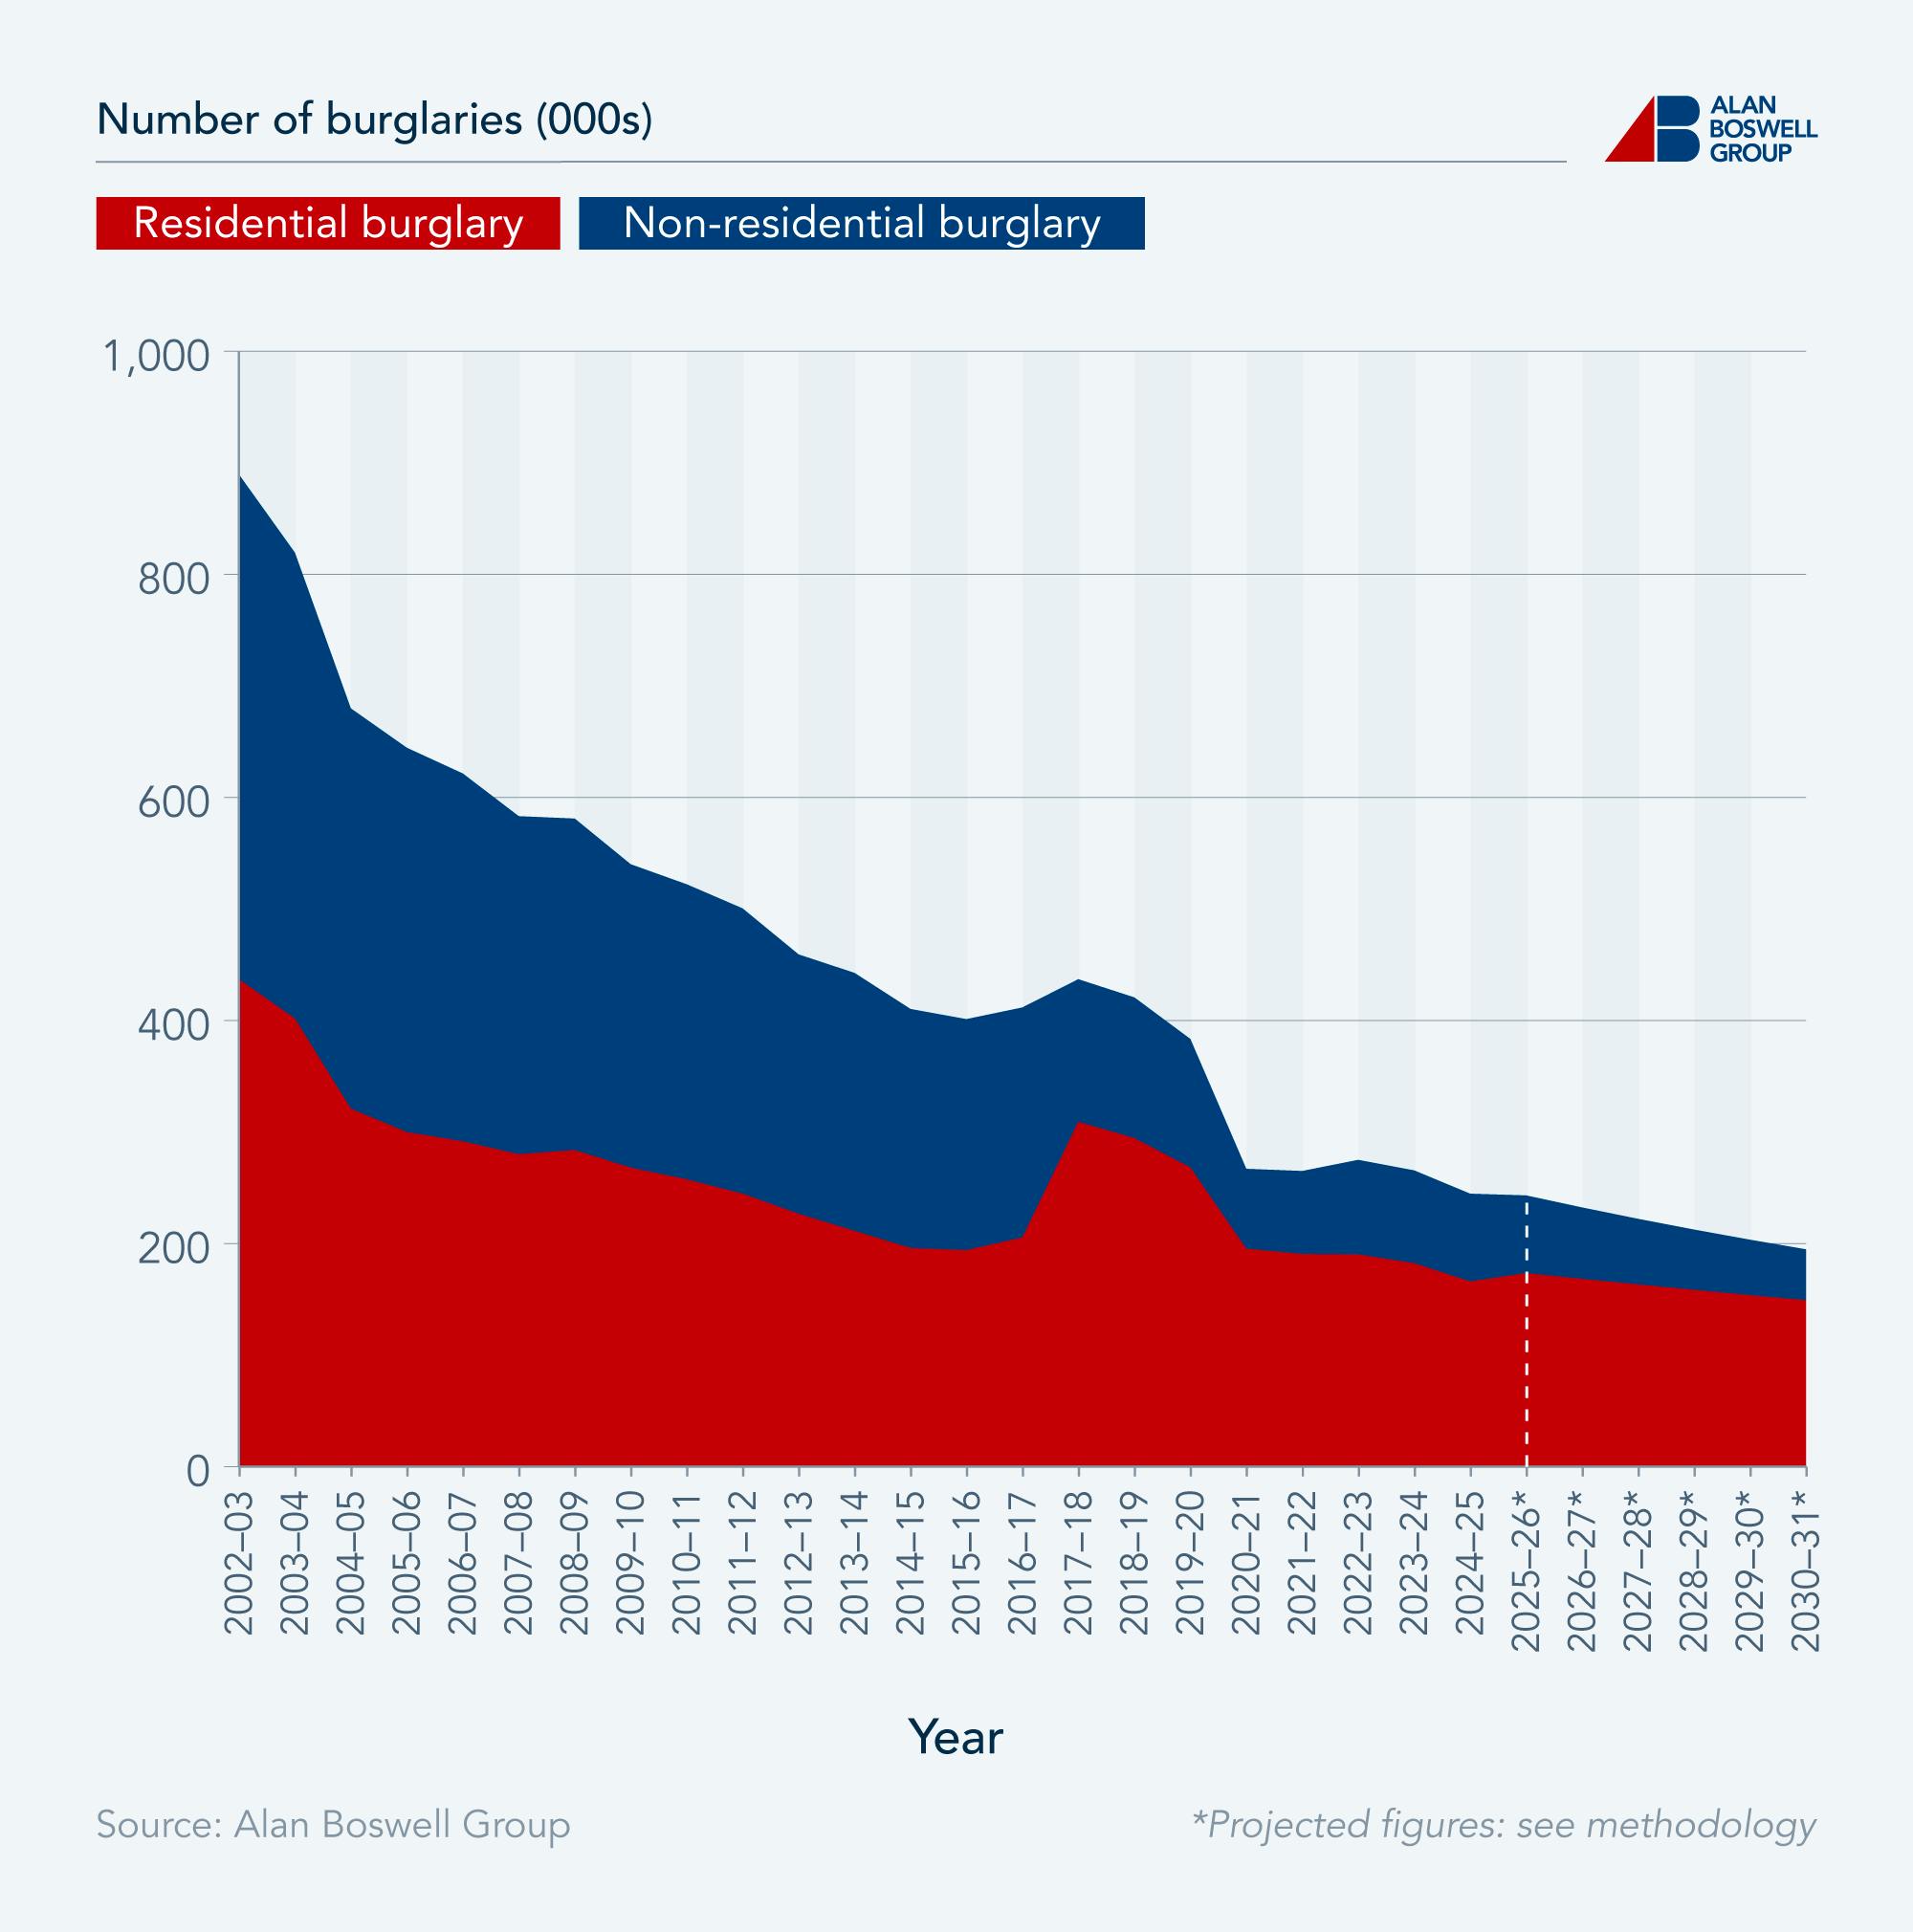
According to the latest property crime statistics from the Office for National Statistics (ONS), there were 245,284 burglaries recorded during the 2024-25 financial year, an all-time low. Of these, over two-thirds (67.91%) were residential burglaries.
Number of residential and non-residential burglaries recorded each financial year, with forecasting up to 2030-31
Test
|
Year |
Residential burglary |
Non-residential burglary |
Total burglary |
|---|---|---|---|
2002-03 |
437,583 |
452,516 |
890,099 |
2003-04 |
402,345 |
417,668 |
820,013 |
2004-05 |
321,507 |
35,8851 |
680,358 |
2005-06 |
300,517 |
344,551 |
645,068 |
2006-07 |
292,260 |
329,752 |
622,012 |
2007-08 |
280,696 |
303,014 |
583,710 |
2008-09 |
284,431 |
297,153 |
581,584 |
2009-10 |
268,606 |
272,039 |
540,645 |
2010-11 |
258,165 |
264,518 |
522,683 |
2011-12 |
245,312 |
255,736 |
501,048 |
2012-13 |
227,276 |
232,519 |
459,795 |
2013-14 |
211,988 |
231,224 |
443,212 |
2014-15 |
196,554 |
214,312 |
410,866 |
2015-16 |
194,696 |
207,072 |
401,768 |
2016-17 |
206,017 |
206,206 |
412,223 |
2017-18 |
309,771 |
127,769 |
437,540 |
2018-19 |
295,122 |
126,120 |
421,242 |
2019-20 |
268,786 |
115,226 |
384,012 |
2020-21 |
195,994 |
71,585 |
267,579 |
2021-22 |
191,259 |
74,369 |
265,628 |
2022-23 |
190,841 |
84,755 |
275,596 |
2023-24 |
182,986 |
83,195 |
266,181 |
2024-25 |
166,577 |
78,707 |
245,284 |
2025-26 |
174,085 |
69,662 |
243,747 |
2026-27 |
168,934 |
64,007 |
232,941 |
2027-28 |
163,935 |
58,811 |
222,746 |
2028-29 |
159,084 |
54,037 |
213,121 |
2029-30 |
154,376 |
49,650 |
204,026 |
2030-31 |
149,808 |
45,619 |
195,427 |
Note: Current classifications replaced Domestic burglary and Non-domestic burglary from April 2017.
Source: Alan Boswell Group
Since 2002, the total number of burglaries reported has largely decreased, despite a short period of increase between 2016 and 2018 and during 2022/23. The number of residential burglaries committed annually has decreased by three-fifths (61.93%), while the number of non-residential burglaries has fallen by 72.44%.
According to forecasts completed by Alan Boswell Group, the total number of burglaries will continue to fall, reaching 195,427 by 2030-31, a decrease of 78.04% over nearly three decades.
By 2030-31, annual residential and non-residential burglary offences are expected to have fallen by 65.76% and 89.92%, respectively, since 2002.
Which areas record the most burglaries?
According to the latest burglary statistics sourced in mid-August 2025, the Royal Borough of Kensington and Chelsea in West London is the most prolific area for burglaries so far in 2025. The area reports a rate of 7.2 burglaries per 1,000 population.
Top 10 areas with the highest burglary rate
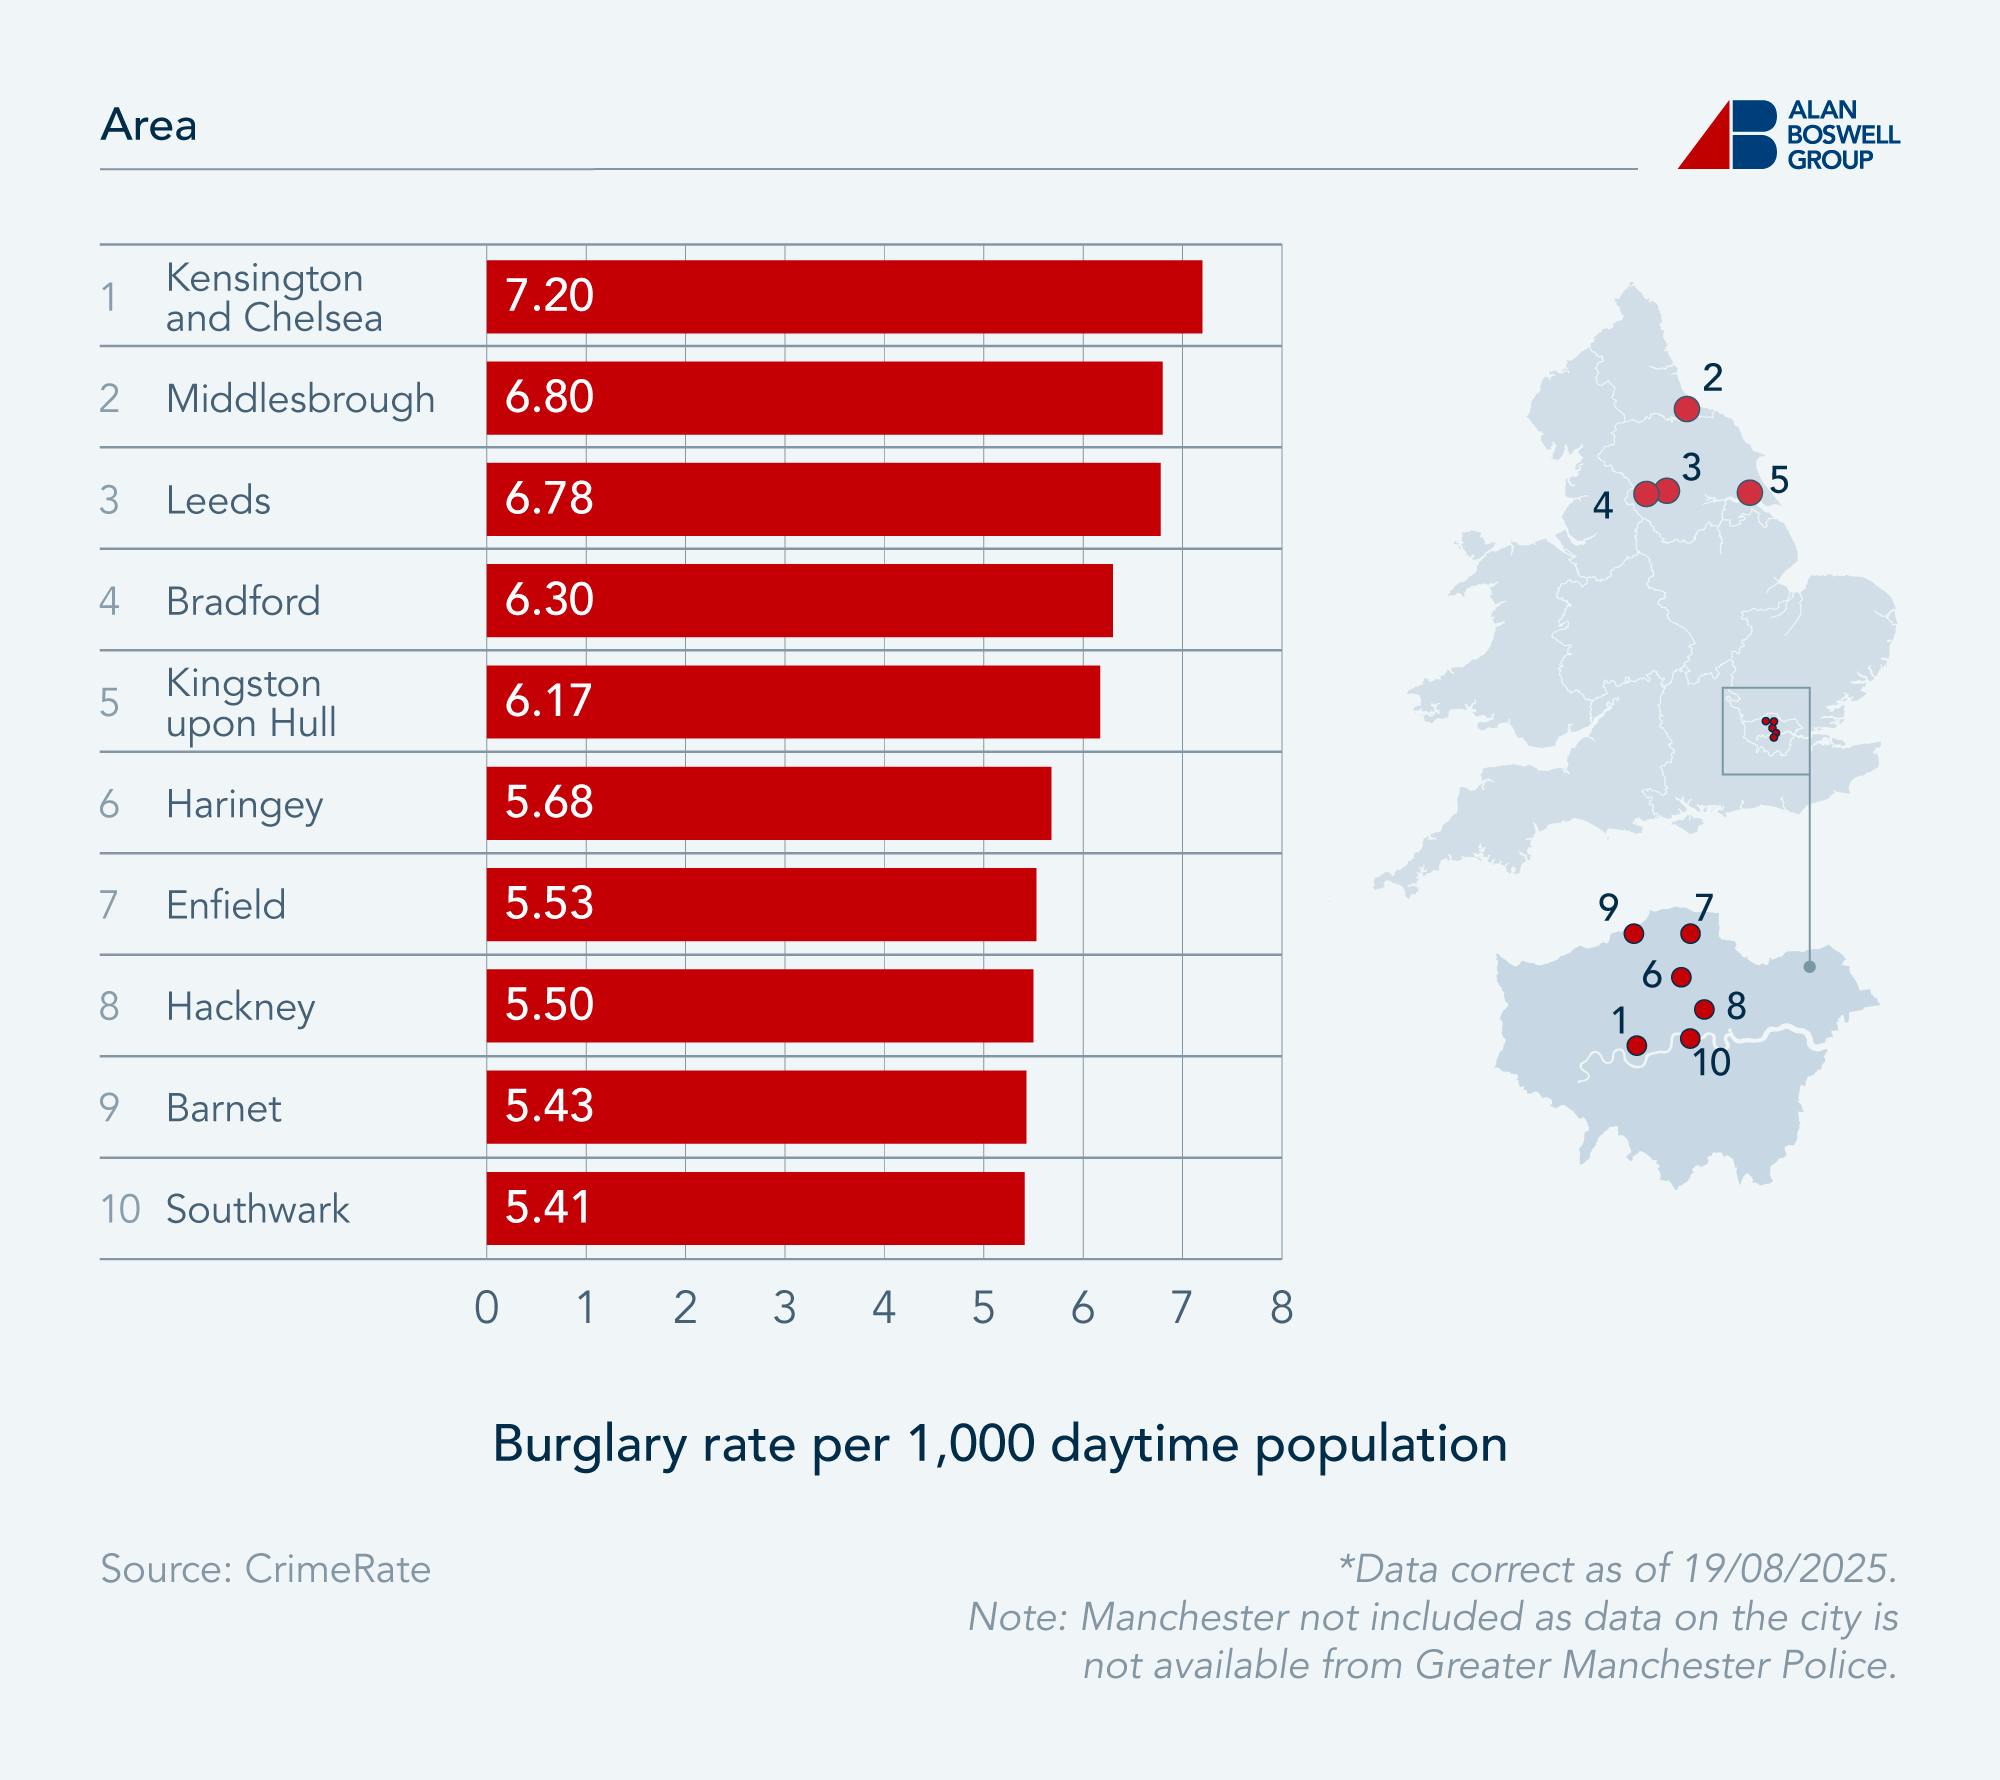
Of the ten areas with the highest burglary offence rate, six are situated in London, while the other four are all in the north of England.
Middlesbrough, in the North East, has the second-highest burglary rate, recording 6.88 offences per 1,000 population. Leeds, Bradford, and Kingston upon Hull, all situated in Yorkshire and the Humber, are in third, fourth, and fifth place, respectively.
While the burglary offence rate in Southwark is almost a quarter (24.86%) lower than that in Kensington and Chelsea, the Central London borough nevertheless records the tenth-highest number of burglaries per 1,000 population in England and Wales.
Which areas record the fewest burglaries?
Conversely, the City of London records the lowest burglary rate. With just 0.70 offences per 1,000 daytime population so far in 2025, the city is the only area in England and Wales to have a burglary rate under 1 per 1,000. This makes the risk of burglary in the City of London 90.28% lower than in Kensington and Chelsea, the borough with the highest rate.
Top 10 areas with the lowest burglary rate
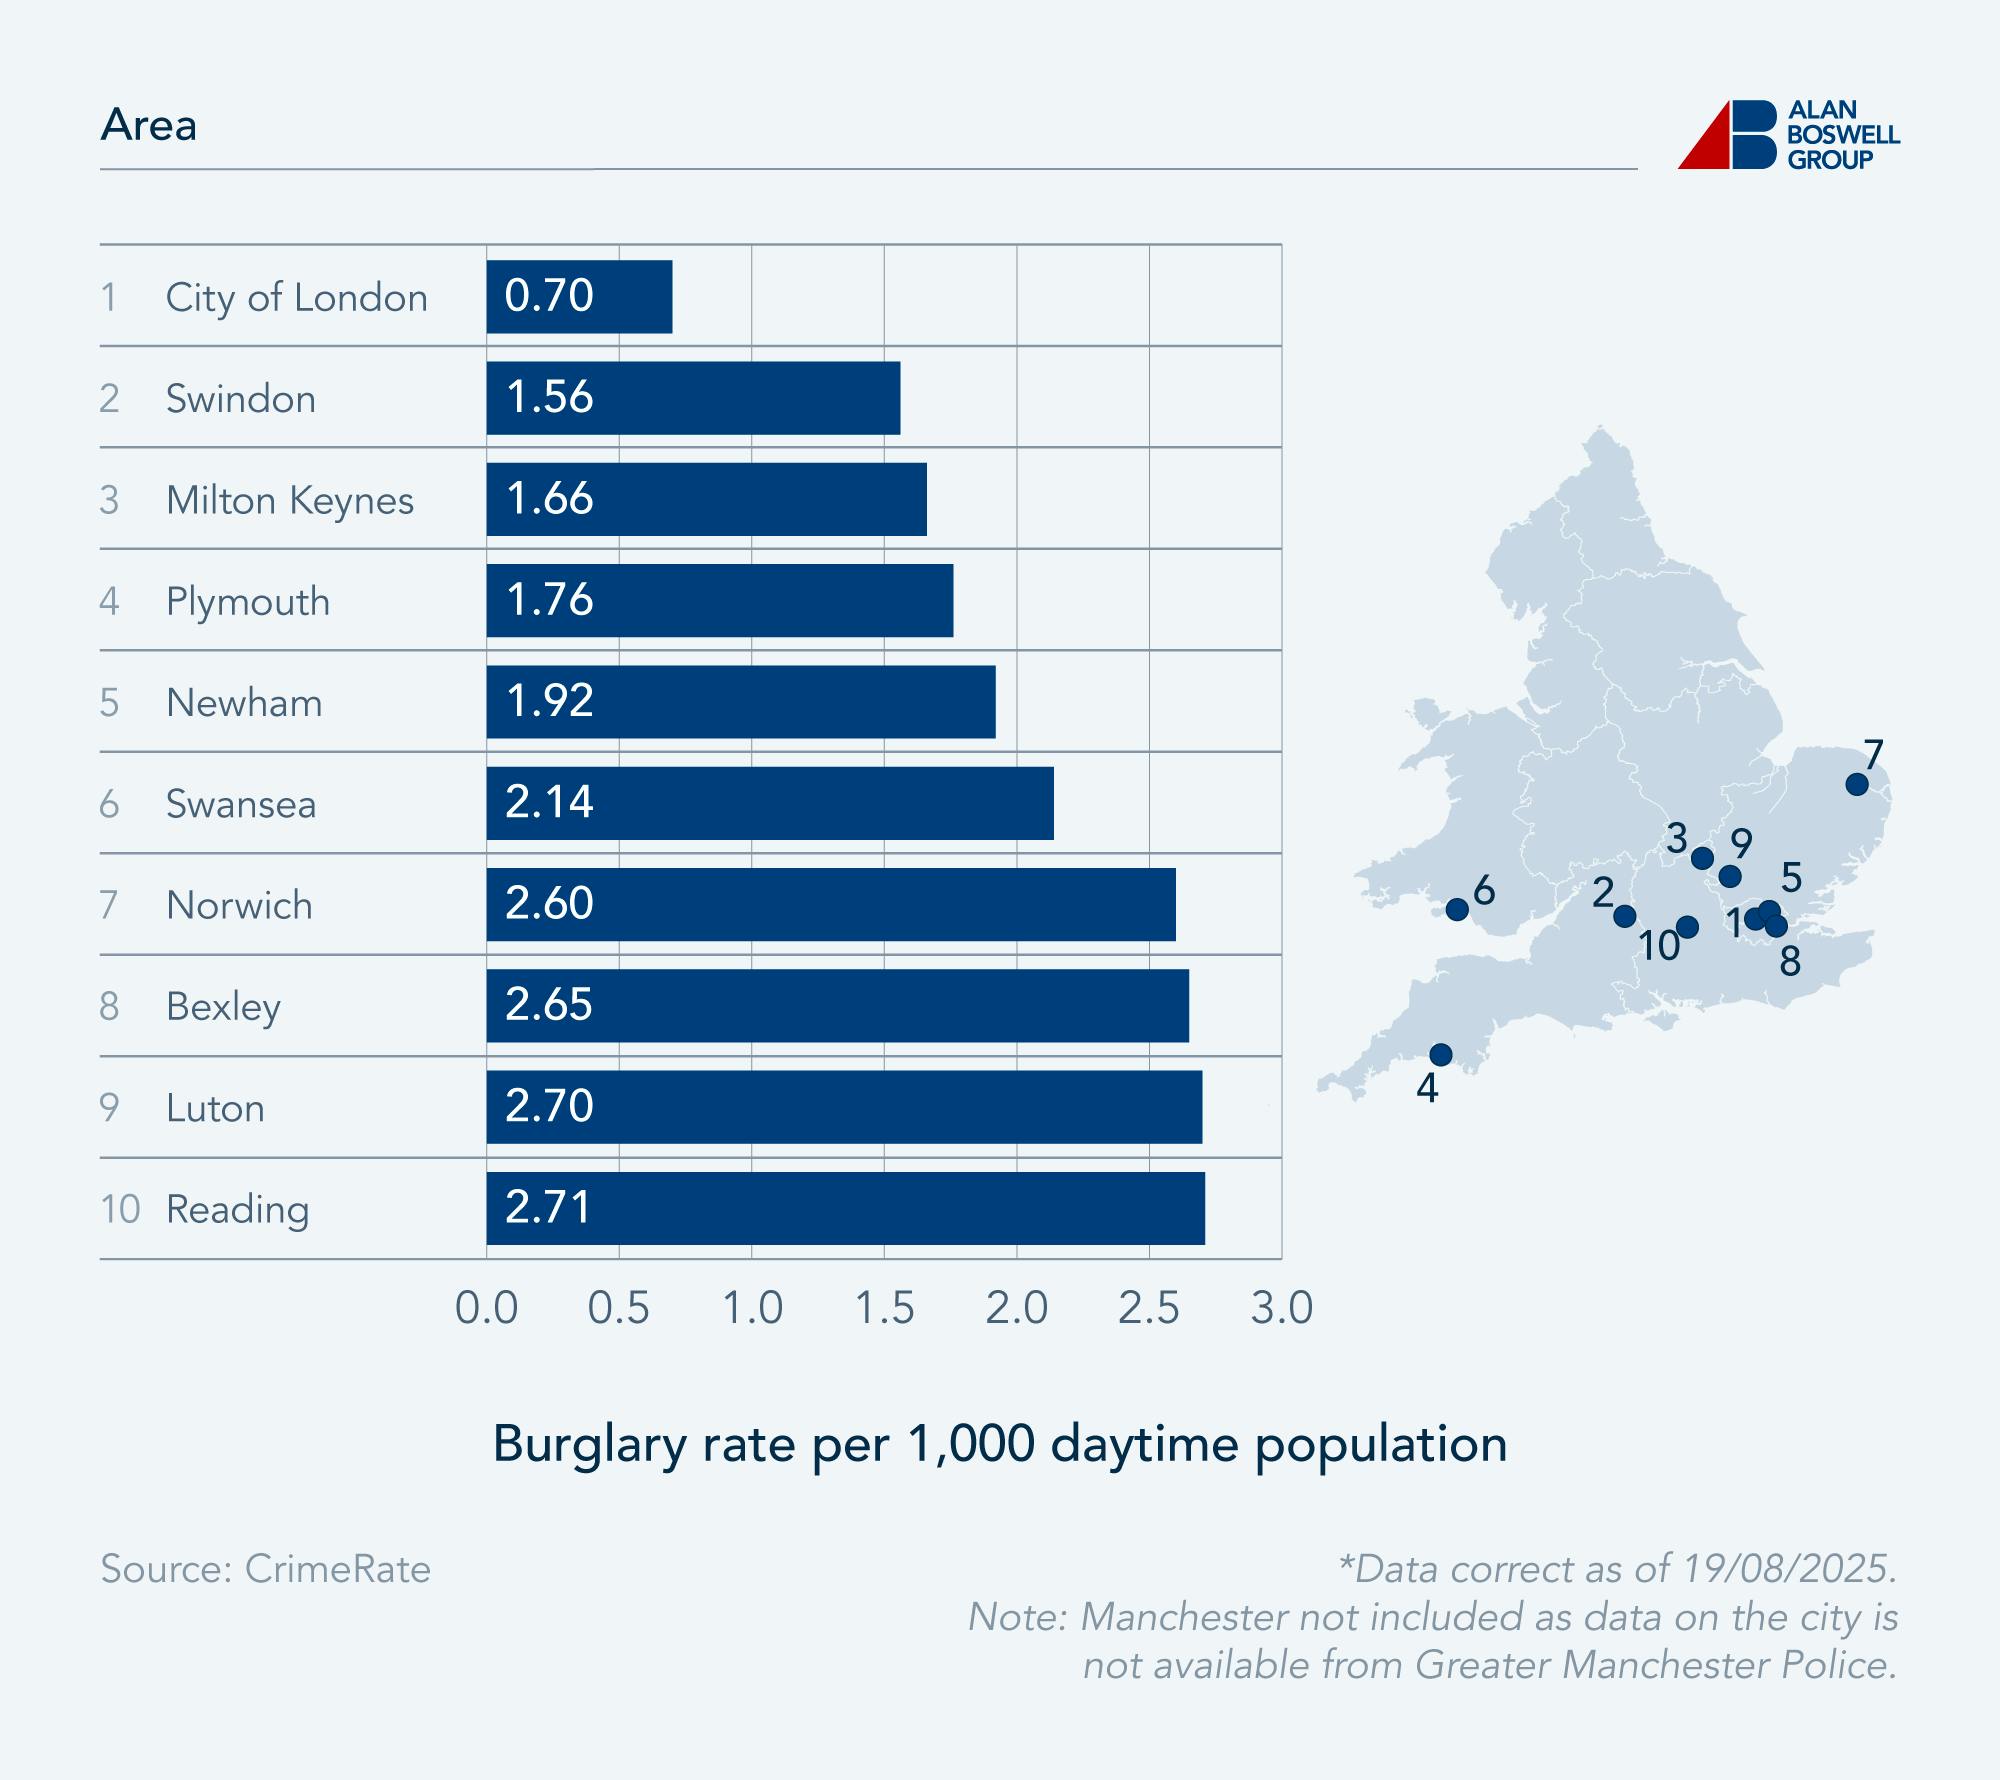
The majority of areas in the top ten towns and cities with the lowest burglary rates are located in the south of England, with just one Welsh area, Swansea, making the list. The second-largest city in Wales, Swansea, has the sixth-lowest burglary rate, at 2.14 per 1,000 population.
Along with the City of London, two other London boroughs sit among the areas with the lowest burglary rates. With 1.92 and 2.65 burglaries per 1,000 daytime population, respectively, the London Boroughs of Newham and Bexley are in fifth and eighth place.
How many burglaries happen at night? The most common times for burglaries to occur
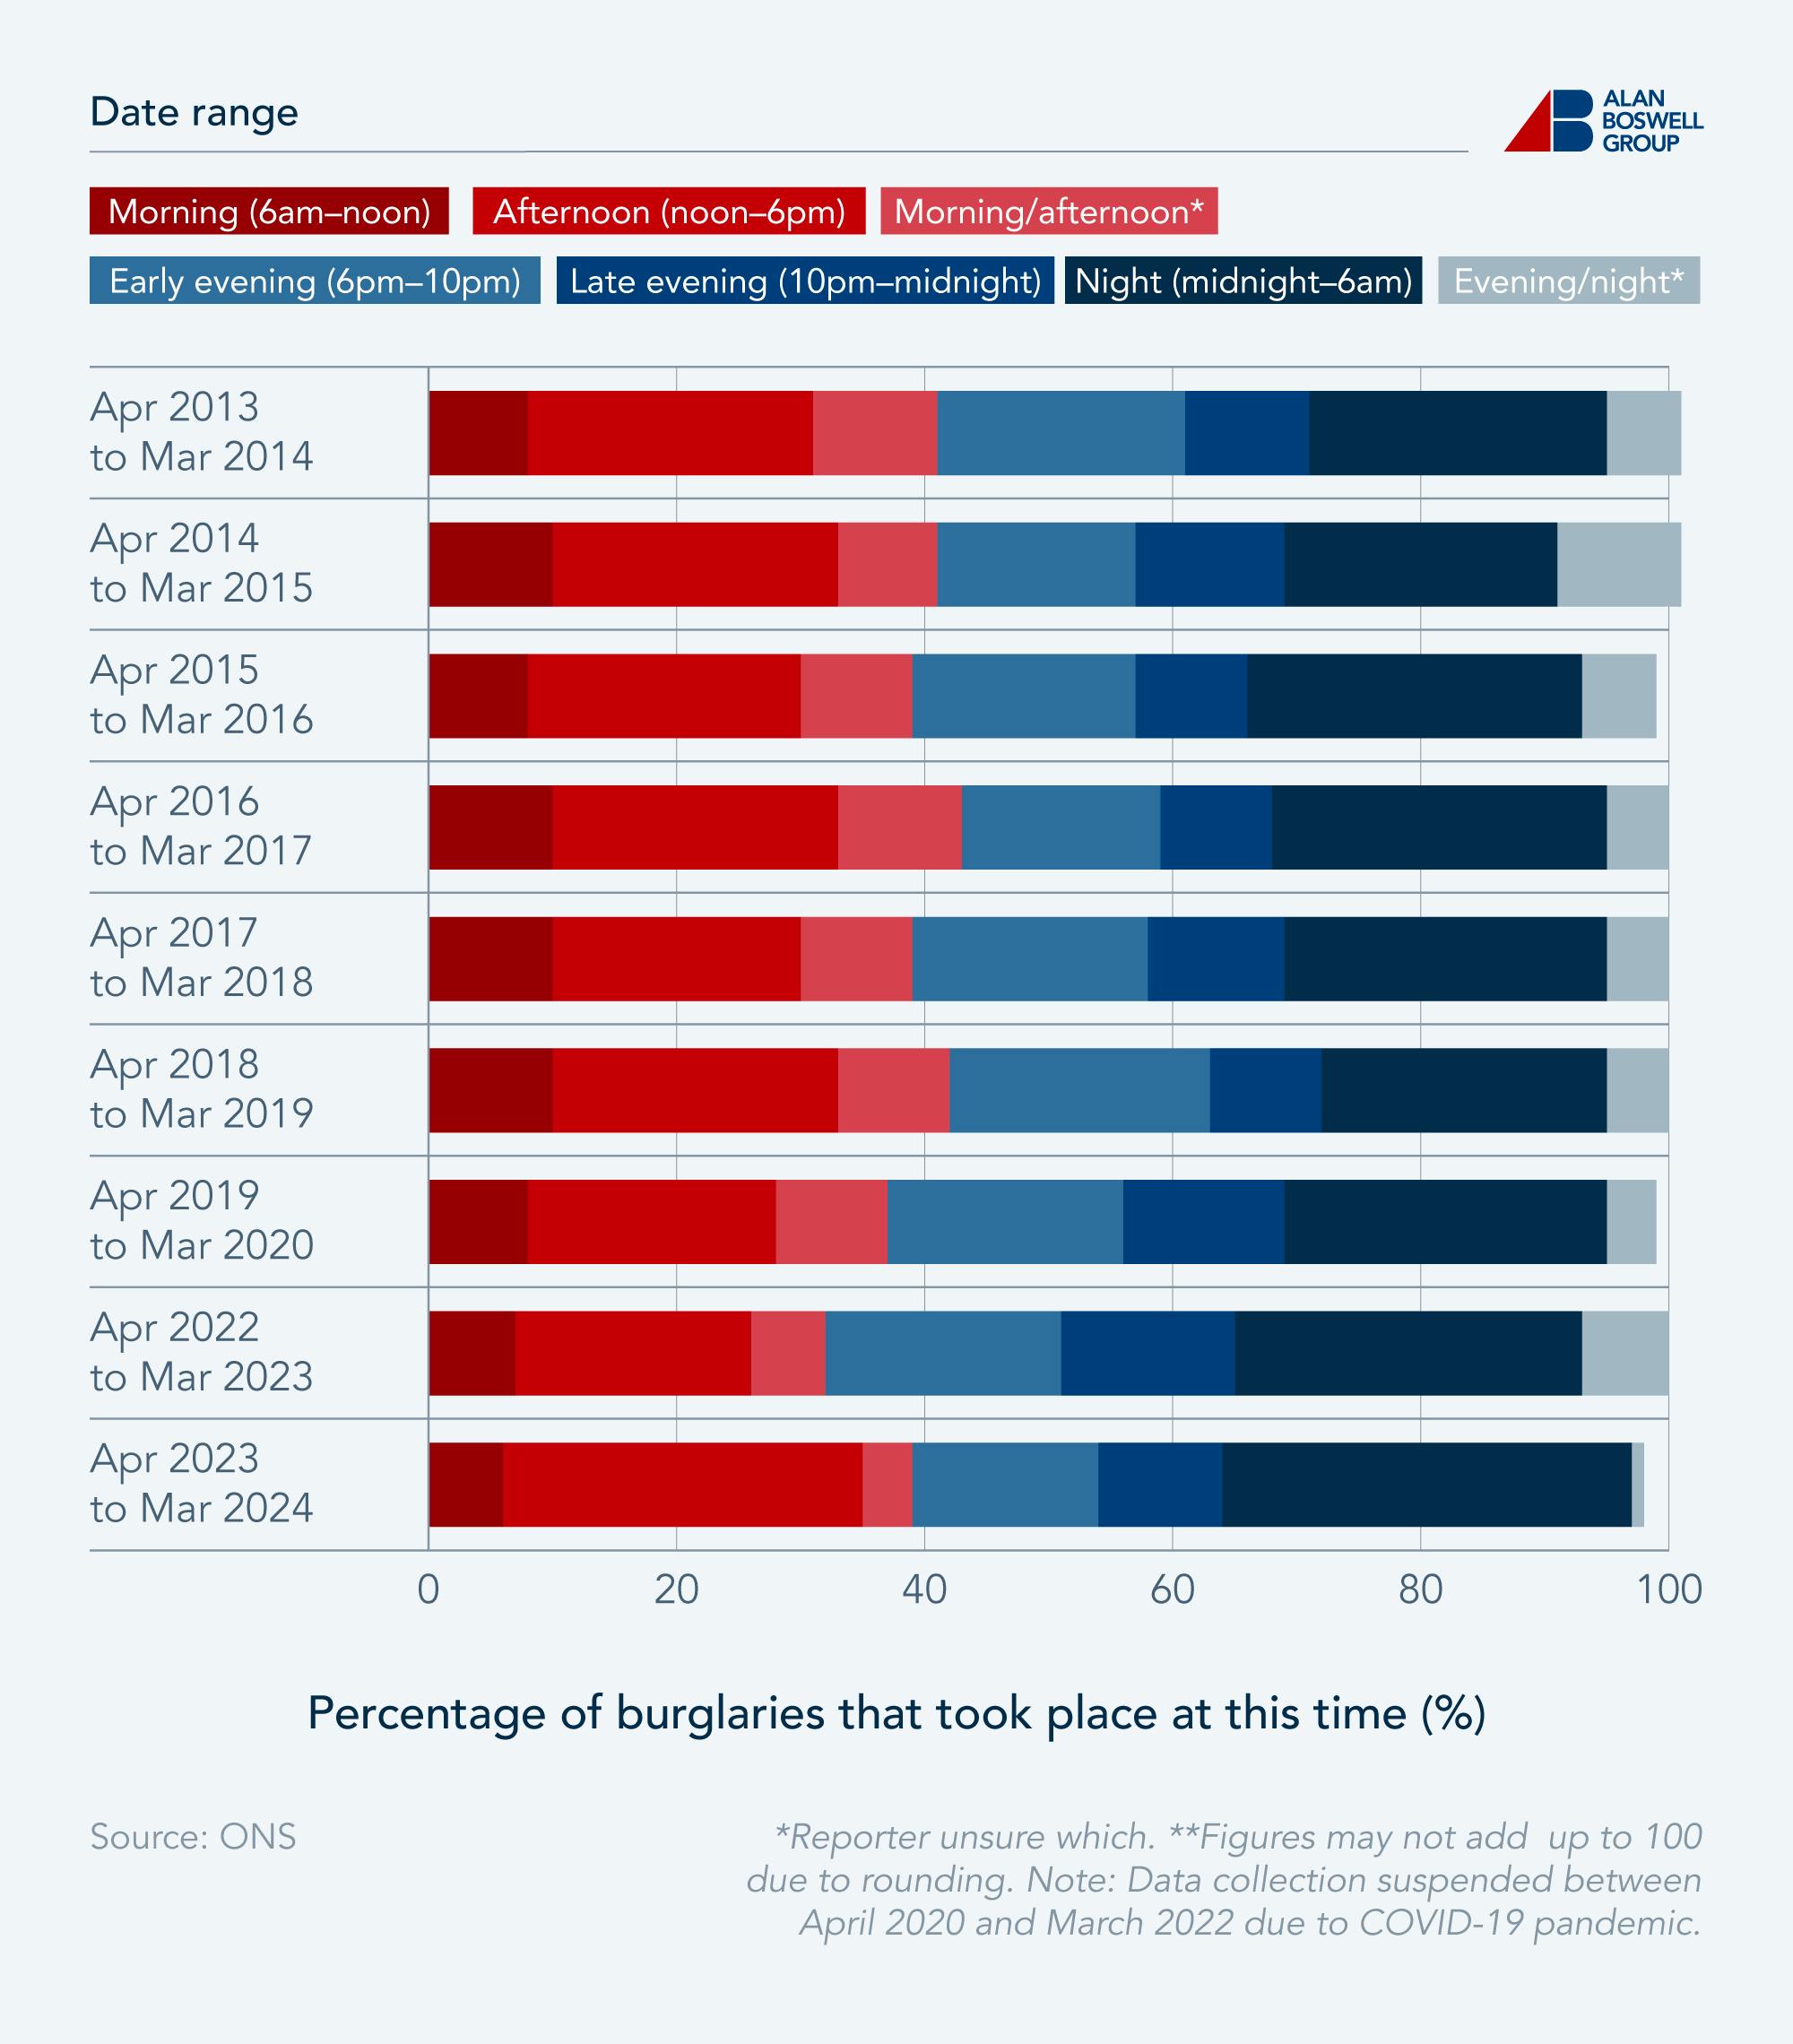
According to the latest burglary statistics from the ONS, during the year April 2023 to March 2024, the majority of burglaries happened at night, between midnight and 6am. A third (33%) of burglaries occurred during this time frame.
The most common times for burglaries to occur
Common times for burglaries
|
Timing |
Apr 2013 to Mar 2014 |
Apr 2014 to Mar 2015 |
Apr 2015 to Mar 2016 |
Apr 2016 to Mar 2017 |
Apr 2017 to Mar 2018 |
Apr 2018 to Mar 2019 |
Apr 2019 to Mar 2020 |
Apr 2022 to Mar 2023 |
Apr 2023 to Mar 2024 |
|---|---|---|---|---|---|---|---|---|---|
Morning (6am-noon) |
8 |
10 |
8 |
10 |
10 |
10 |
8 |
7 |
6 |
Afternoon (noon-6pm) |
23 |
23 |
22 |
23 |
20 |
23 |
20 |
19 |
29 |
Morning/afternoon (unsure which) |
10 |
8 |
9 |
10 |
9 |
9 |
9 |
6 |
4 |
Early evening (6pm-10pm) |
20 |
16 |
18 |
16 |
19 |
21 |
19 |
19 |
15 |
Late evening (10pm-midnight) |
10 |
12 |
9 |
9 |
11 |
9 |
13 |
14 |
10 |
Night (midnight-6am) |
24 |
22 |
27 |
27 |
26 |
23 |
26 |
28 |
33 |
Evening/night (unsure which) |
6 |
10 |
6 |
5 |
5 |
5 |
4 |
7 |
1 |
Daylight |
43 |
41 |
43 |
47 |
37 |
42 |
38 |
36 |
35 |
Dark |
52 |
54 |
53 |
50 |
58 |
53 |
58 |
56 |
59 |
Dawn/dusk |
5 |
5 |
4 |
4 |
5 |
5 |
4 |
8 |
5 |
*Figures may not add up to 100 due to rounding.
Note: Data collection suspended between April 2020 and March 2022 due to COVID-19 pandemic. Source: ONS
The second most common time for burglaries to occur was in the afternoon, between noon and 6pm. Although this is one of the brightest times of the day, it is also when most homeowners are at work, highlighting the importance of proper security measures in the home.
There has been a fair amount of change in the typical timing of burglaries over the last decade. From April 2013 to March 2014, a third more burglaries occurred during the early evening (6pm-10pm) than in 2023-24 (20% vs 15%), while a fifth (20.69%) fewer burglaries occurred during the afternoon in 2013-14 than in 2023-24 (23% vs 29%).
Despite some fluctuation in the proportion of burglaries occurring around dawn and dusk over the past decade, the figure has returned to 5%. However, the proportion of burglaries occurring during the dark has risen by 13.46% over the decade, while the proportion of those occurring during daylight has fallen by 18.6%.
The most common days for burglaries to occur

As is to be expected, the majority of burglaries occur during the week, when homeowners and tenants are most likely to be out of the house. Just under seven in ten recorded burglary offences in 2023-24 occurred during the week, up 2.99% from 2013-14.
However, when taking into account the relative length of these periods (five days vs. two days), properties were 12% more likely to be burgled on a weekend day than a weekday in 2023-24.
Do burglaries occur via the front or back of the house?
In 2023-24, the majority of burglaries occurred as a result of gaining access via the front of the house, according to the latest property crime statistics from the ONS. In over two-thirds of burglaries, criminals used the front of the property as the point of entry, up from just over half in 2013-14, a rise of over a quarter (28.85%).
The most common point of entry used in burglaries
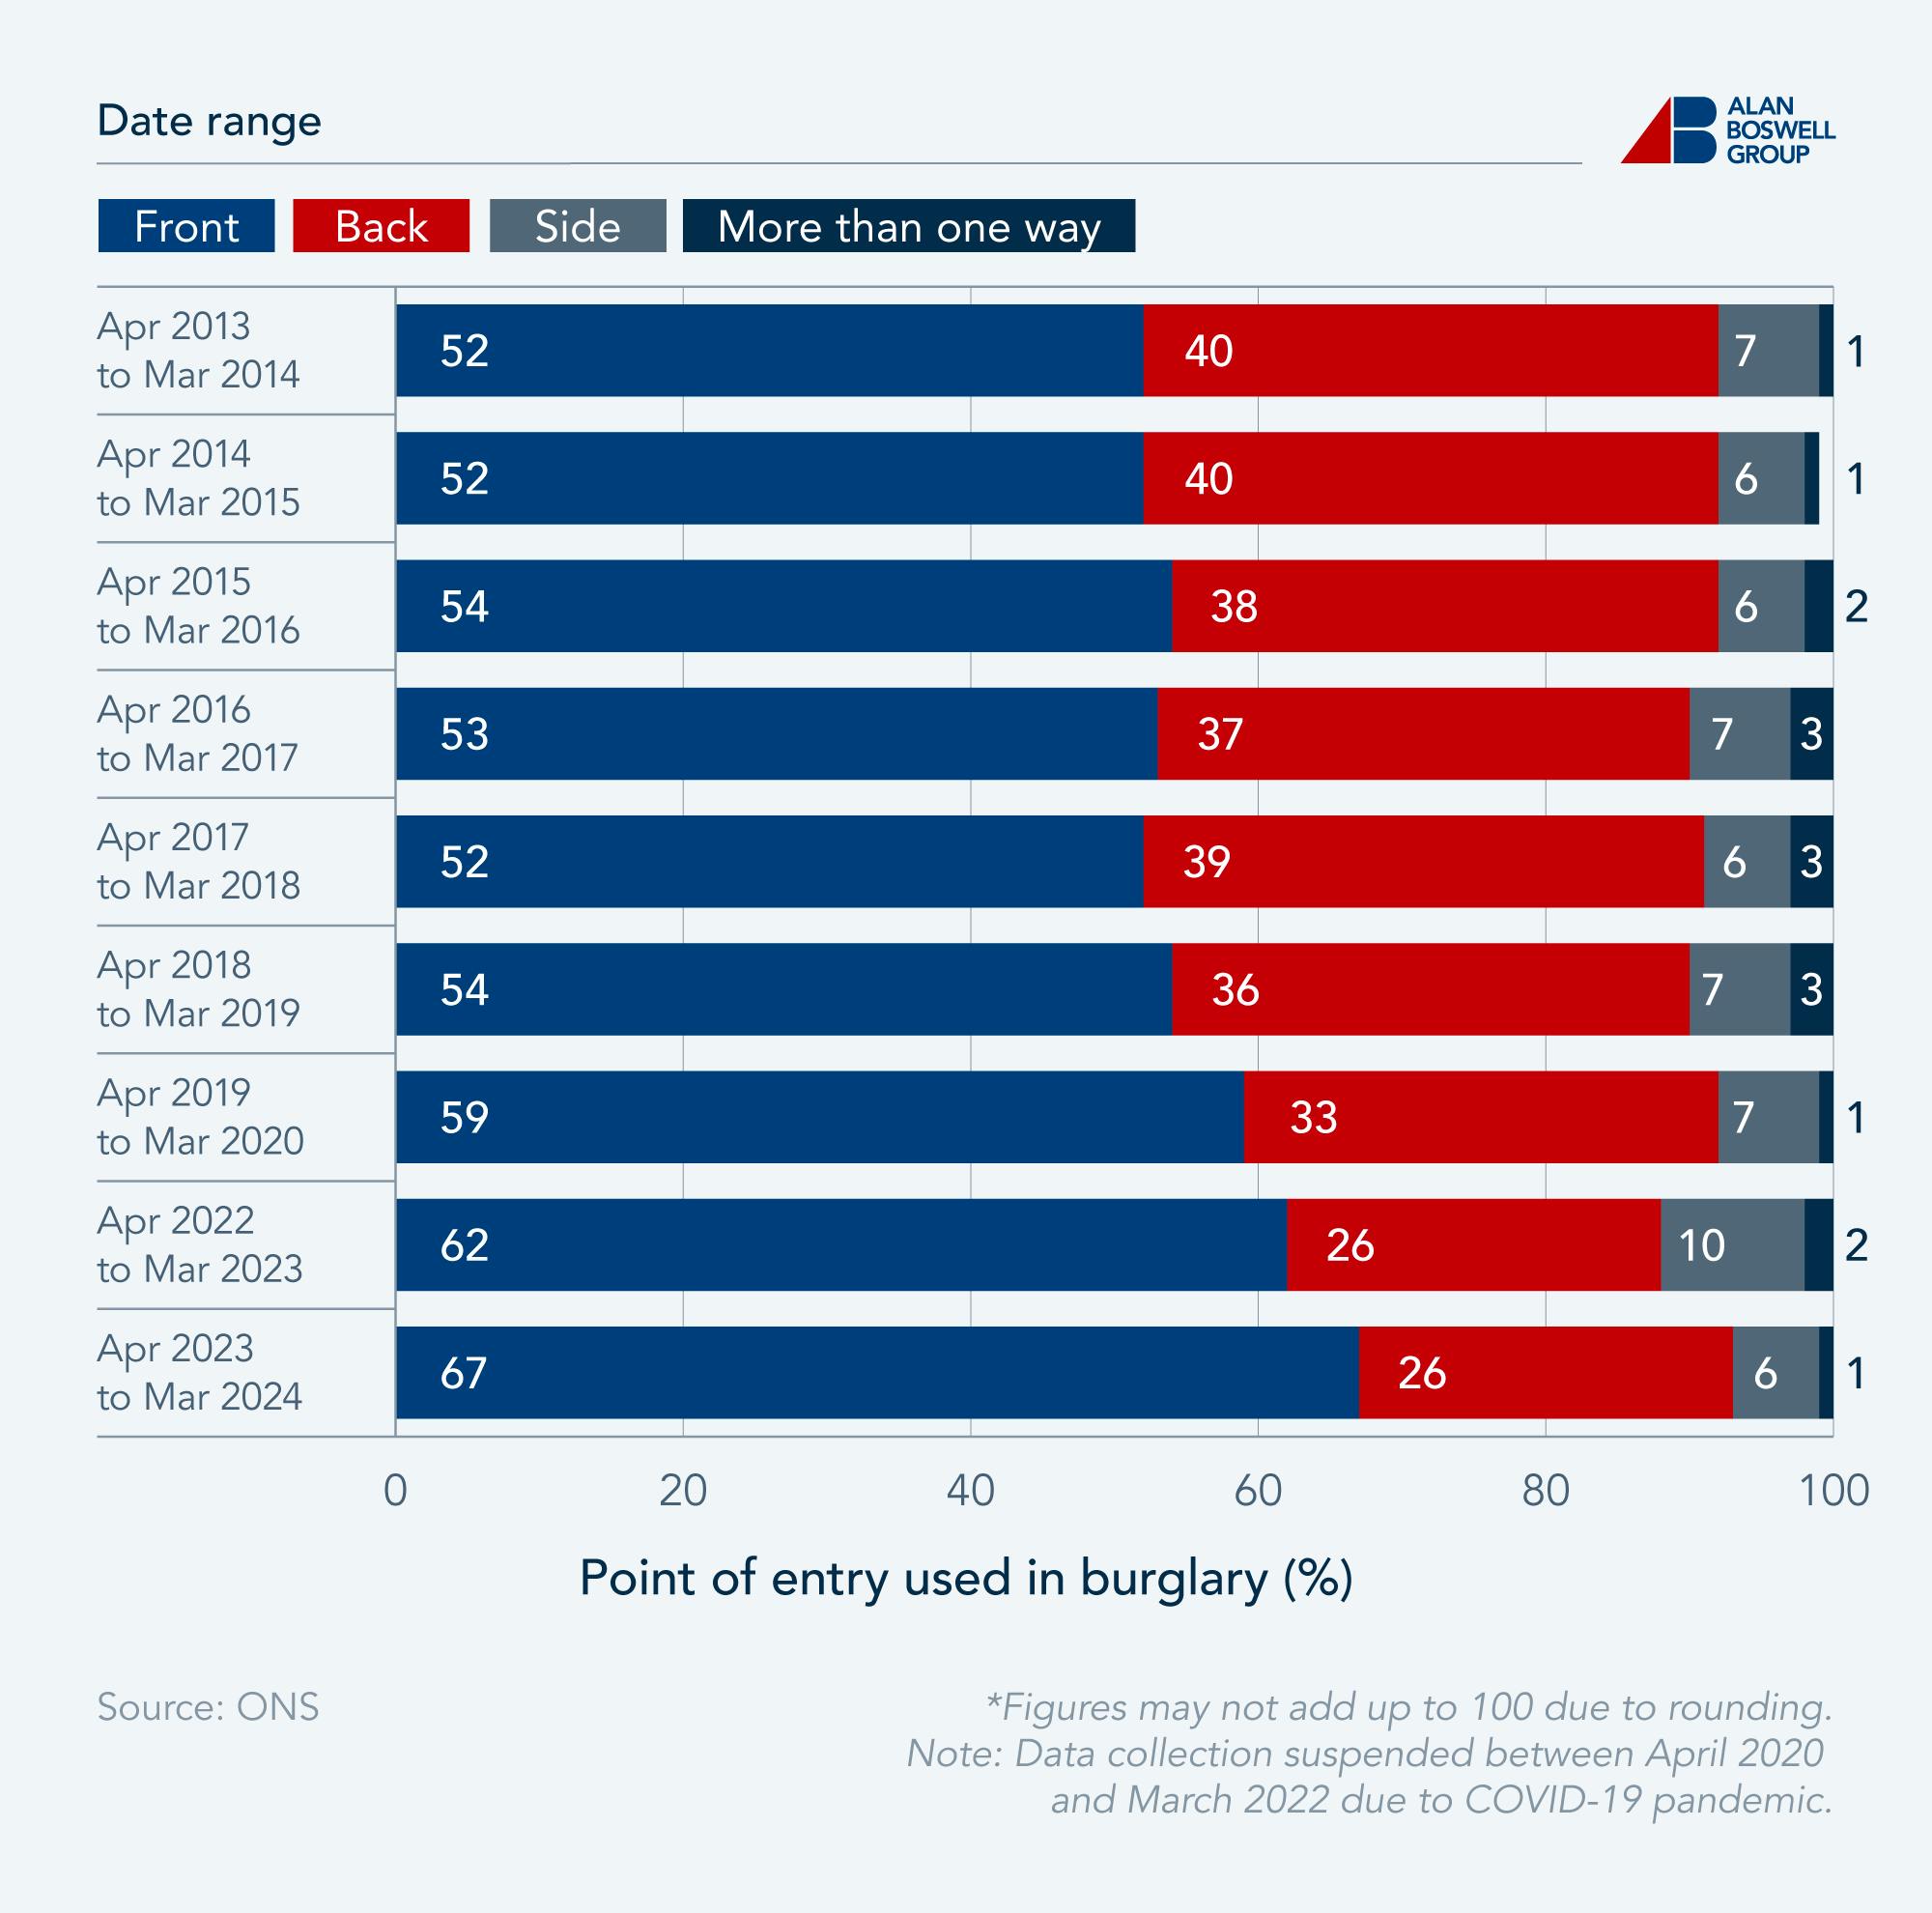
Instances of criminals gaining access from the side of the home have remained somewhat stable, while the proportion of burglaries that occurred via the back of the home has decreased significantly over the past decade. In 2013-24, two-fifths of offences occurred via the back of the property, falling by over a third to a quarter in 2023-24.
How do burglars break in? The most common ways burglars gain access to property
In the majority of cases of burglary in 2023-24, criminals were able to gain access by forcing the lock on a door, with this method being used in over a quarter (27%) of burglaries. Burglary statistics indicate that this method has fluctuated in prevalence slightly over the past decade, to a high of a third in 2019-20 and 2022-23.
The most common method of entry used in burglaries
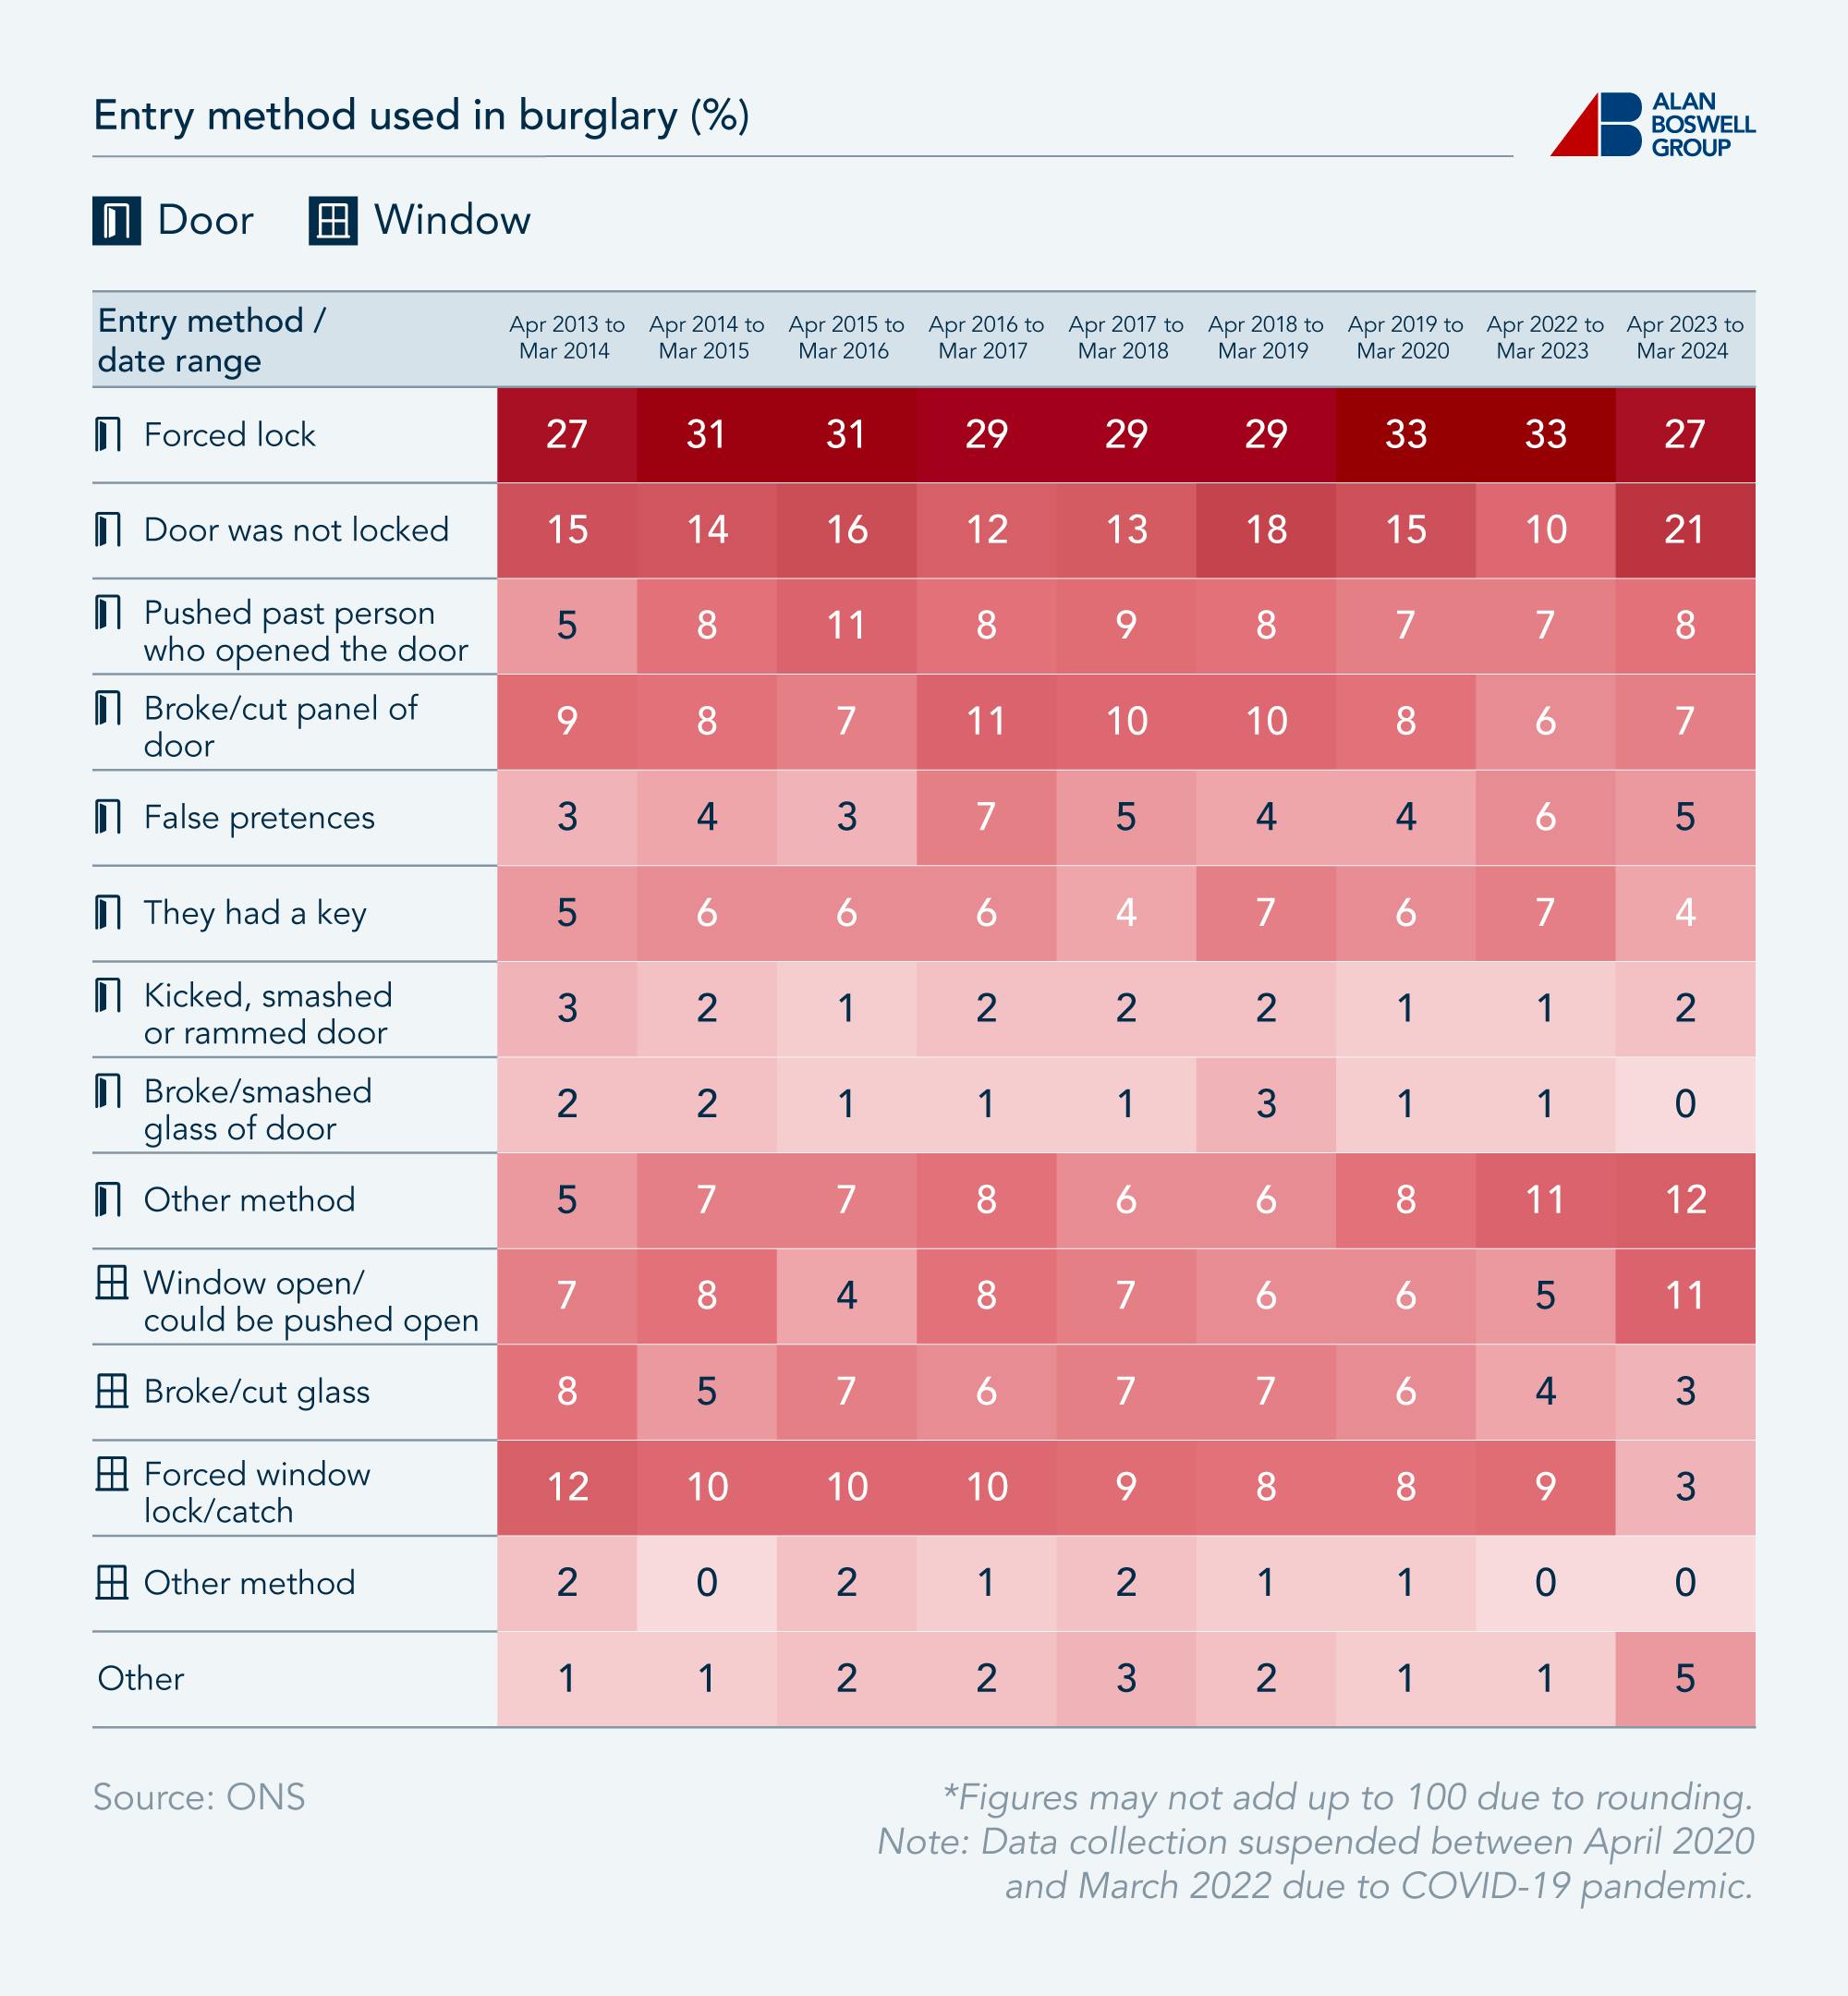
Worryingly, the second-most common method of entry in 2023-24 was via an unlocked door, seen in a fifth of cases. Insurance policies are unlikely to cover you for loss if the crime occurred as a result of negligence, which includes leaving doors and windows unlocked (the latter of which was the method of entry in a tenth of cases).
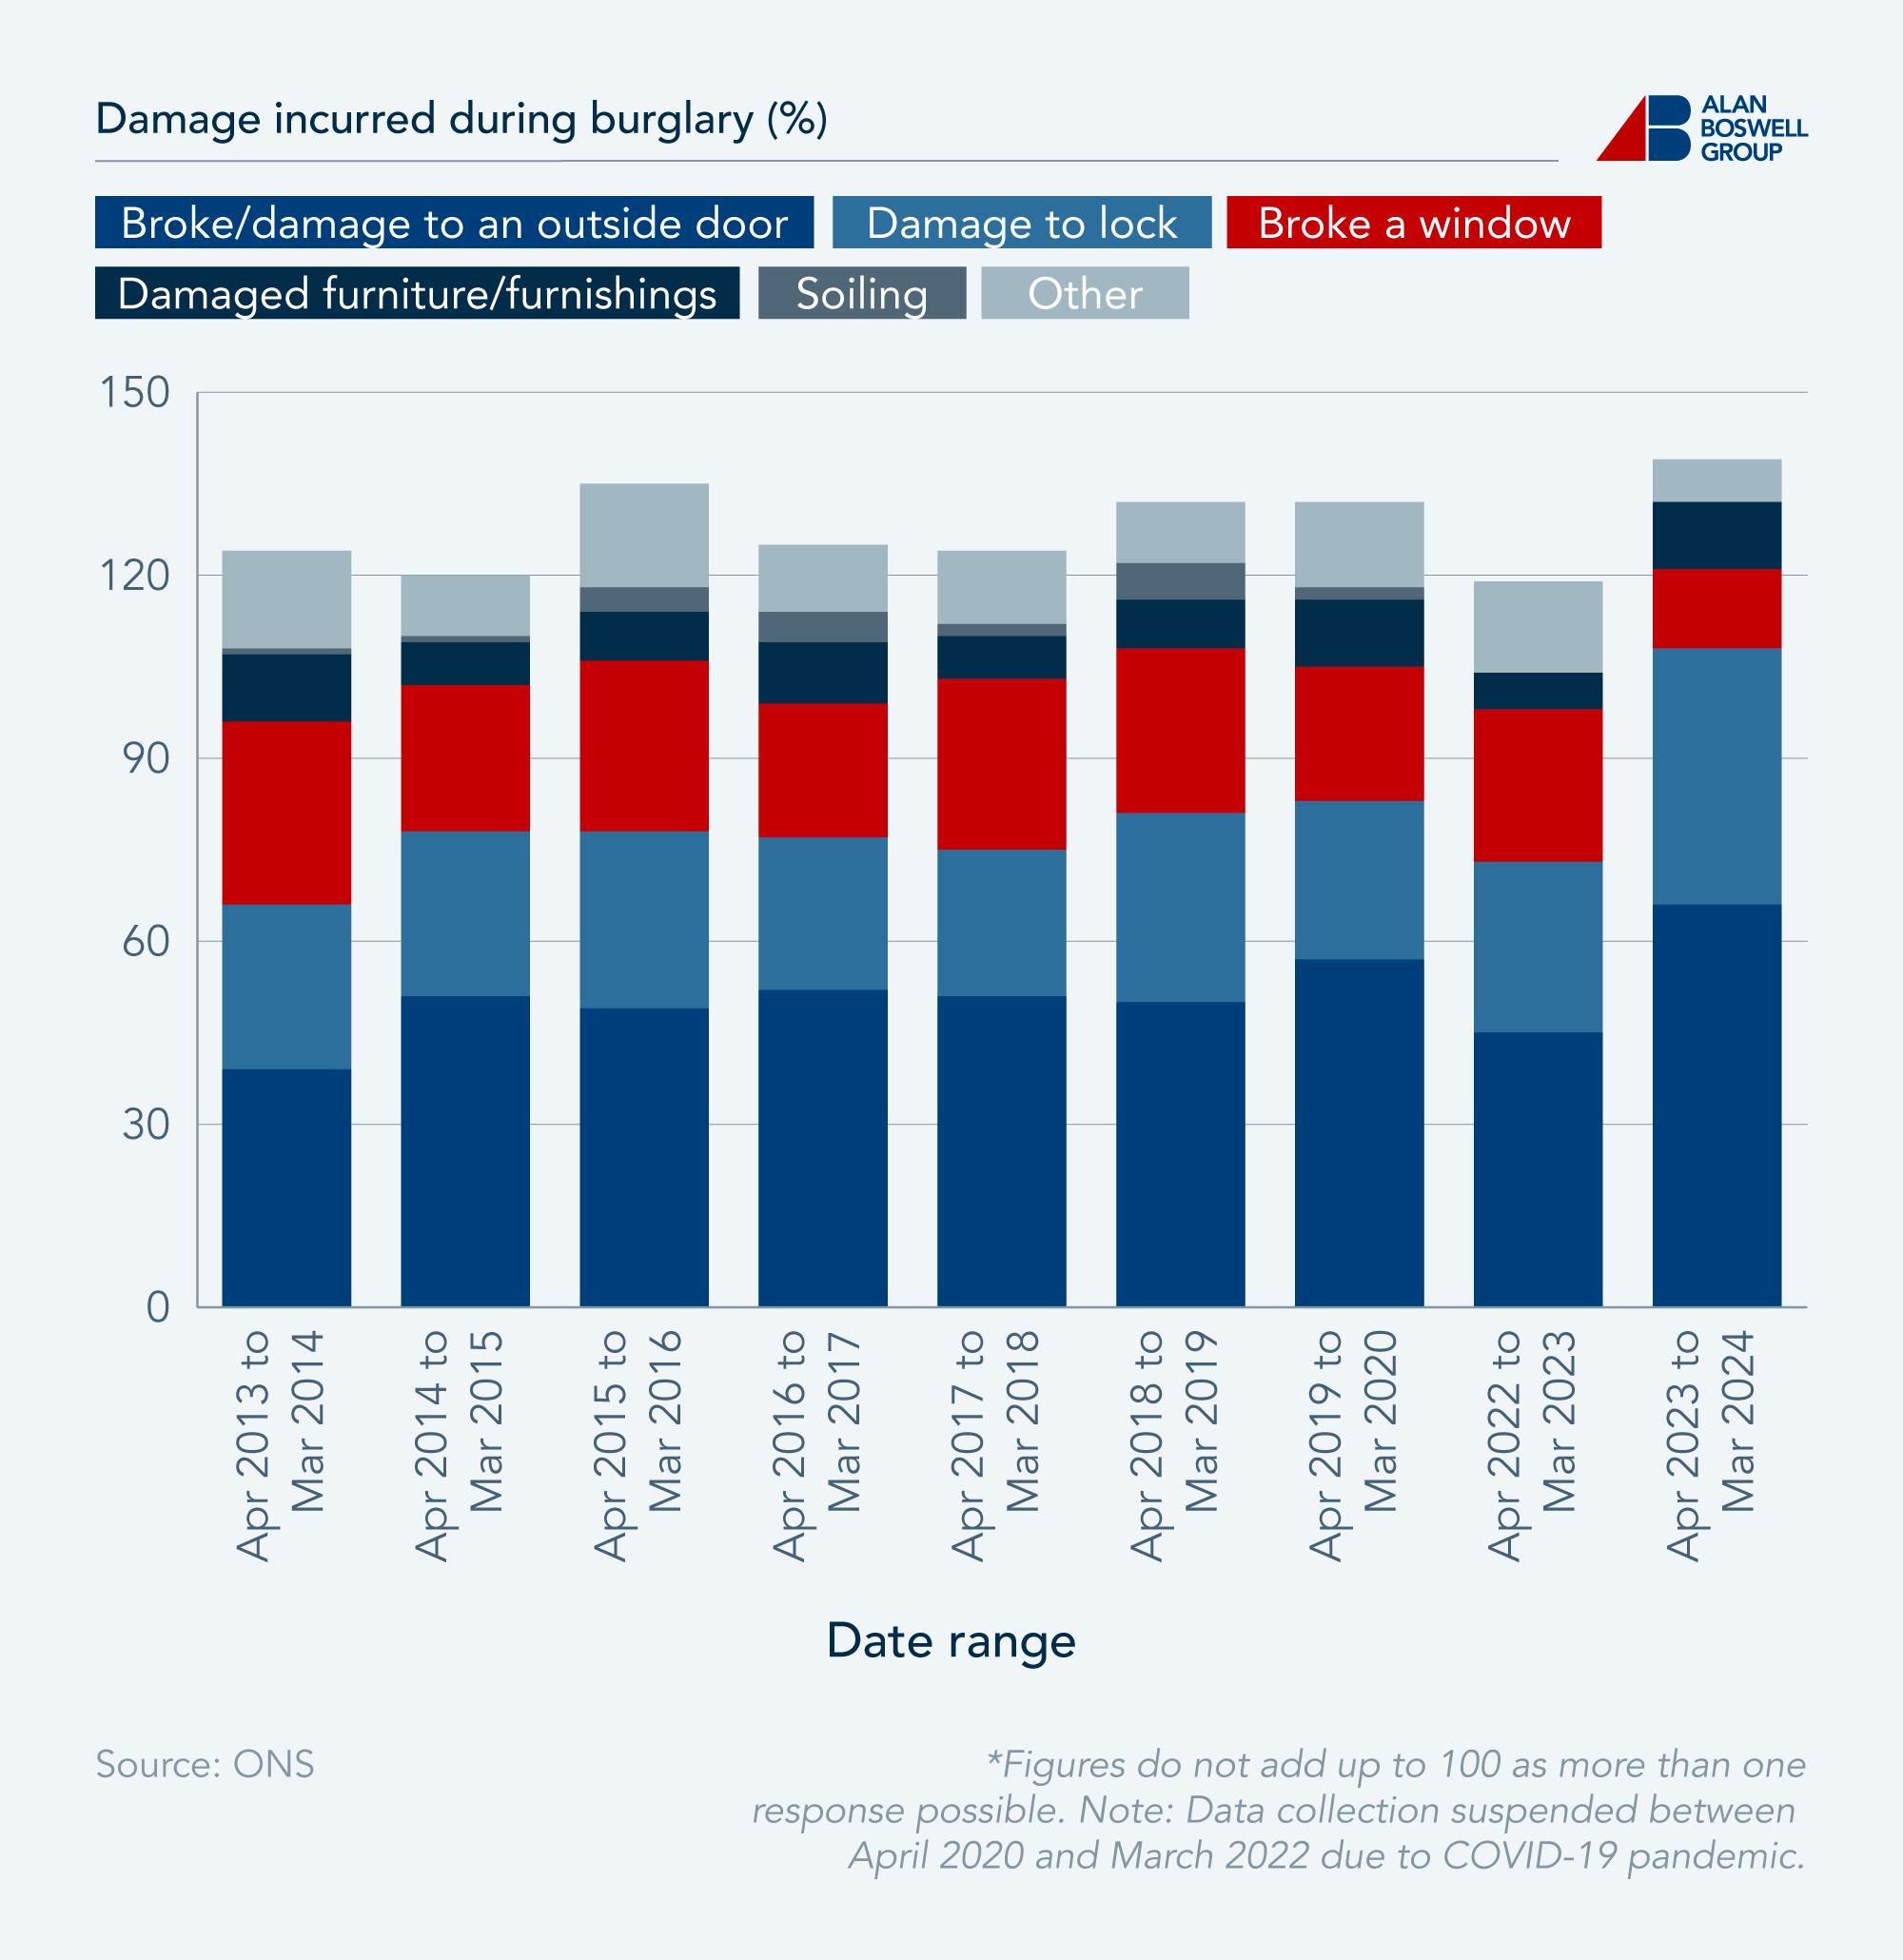
What kind of property damage occurs during a burglary?
In line with forced doors being the most common method of entry, the most common damage incurred as a result of burglaries is a broken or damaged outside door. This type of property damage occurred in two-thirds of burglaries in 2023-24.
Landlord home emergency cover protects you in the event your external locks, doors, or windows are damaged as a result of burglary.
The most common damage incurred as a result of burglaries
|
Type of damage categories |
Apr 2013 to Mar 2014 |
Apr 2014 to Mar 2015 |
Apr 2015 to Mar 2016 |
Apr 2016 to Mar 2017 |
Apr 2017 to Mar 2018 |
Apr 2018 to Mar 2019 |
Apr 2019 to Mar 2020 |
Apr 2022 to Mar 2023 |
Apr 2023 to Mar 2024 |
|---|---|---|---|---|---|---|---|---|---|
Broke/damage to an outside door |
39 |
51 |
49 |
52 |
51 |
50 |
57 |
45 |
66 |
Damage to lock |
27 |
27 |
29 |
25 |
24 |
31 |
26 |
28 |
42 |
Broke a window |
30 |
24 |
28 |
22 |
28 |
27 |
22 |
25 |
13 |
Damaged furniture/furnishings |
11 |
7 |
8 |
10 |
7 |
8 |
11 |
6 |
11 |
Graffiti |
0 |
0 |
0 |
0 |
0 |
0 |
0 |
0 |
0 |
Soiling |
1 |
1 |
4 |
5 |
2 |
6 |
2 |
0 |
0 |
Other |
16 |
10 |
17 |
11 |
12 |
10 |
14 |
15 |
7 |
*Figures do not add up to 100 as more than one response is possible. Note: Data collection suspended between April 2020 and March 2022 due to COVID-19 pandemic. Source: ONS
Similarly, property crime statistics reveal that damage to a lock occurred in over a fifth of burglary cases.
The proportion of broken windows incurred during burglaries fell by 56.67% over the past decade, which is in line with the falling trend of burglars gaining access by breaking or cutting window glass or by forcing a window lock.
What are the most popular property security measures?
According to the ONS, in the period from April 2023 to March 2024, nearly nine in ten homes had locks on their windows, and four-fifths had deadlocks installed on their doors.
The most popular property security measures
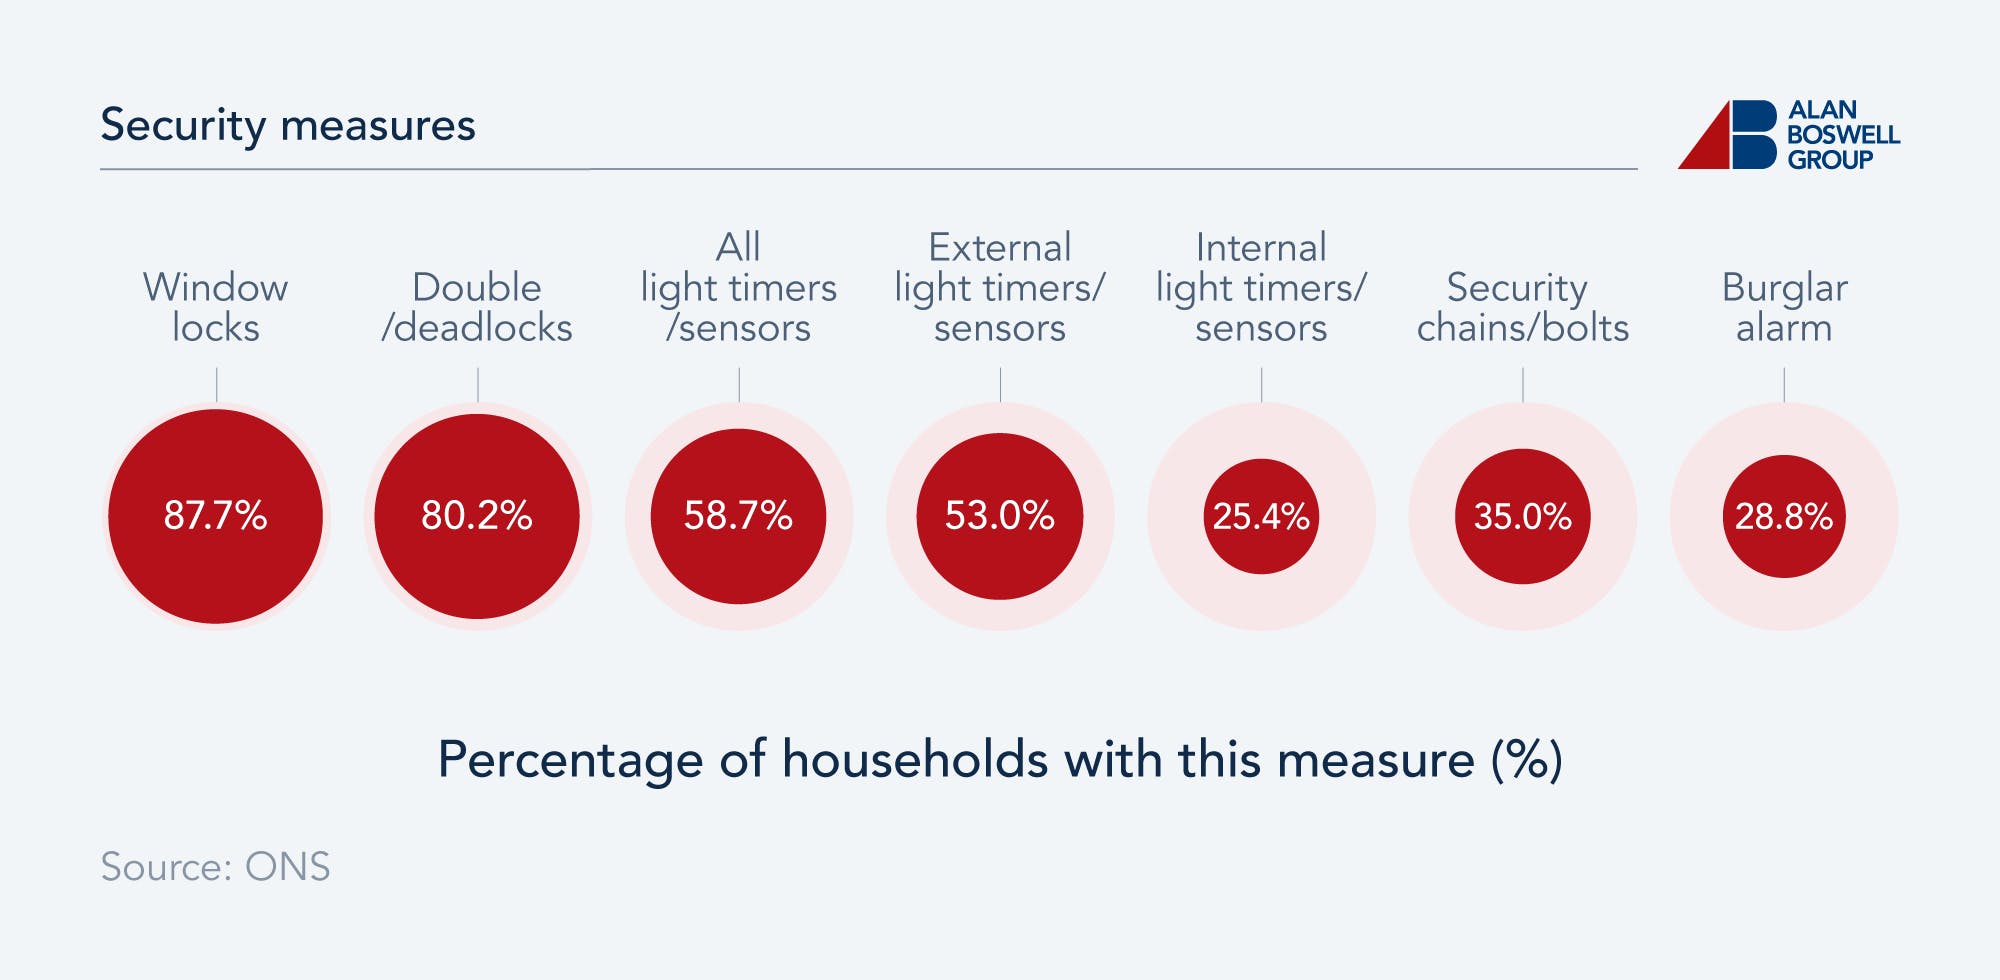
Lights on timers and sensors are the third most popular property security measure, with over half of homes having external lights with timers/sensors fitted. However, internal lights with timers and sensors are less popular, with only a quarter of homes reporting having these.
Alongside installing security measures, if a property is empty due to the owner passing away, probate house insurance offers those in control of the estate peace of mind that the property will be covered against theft and property damage.
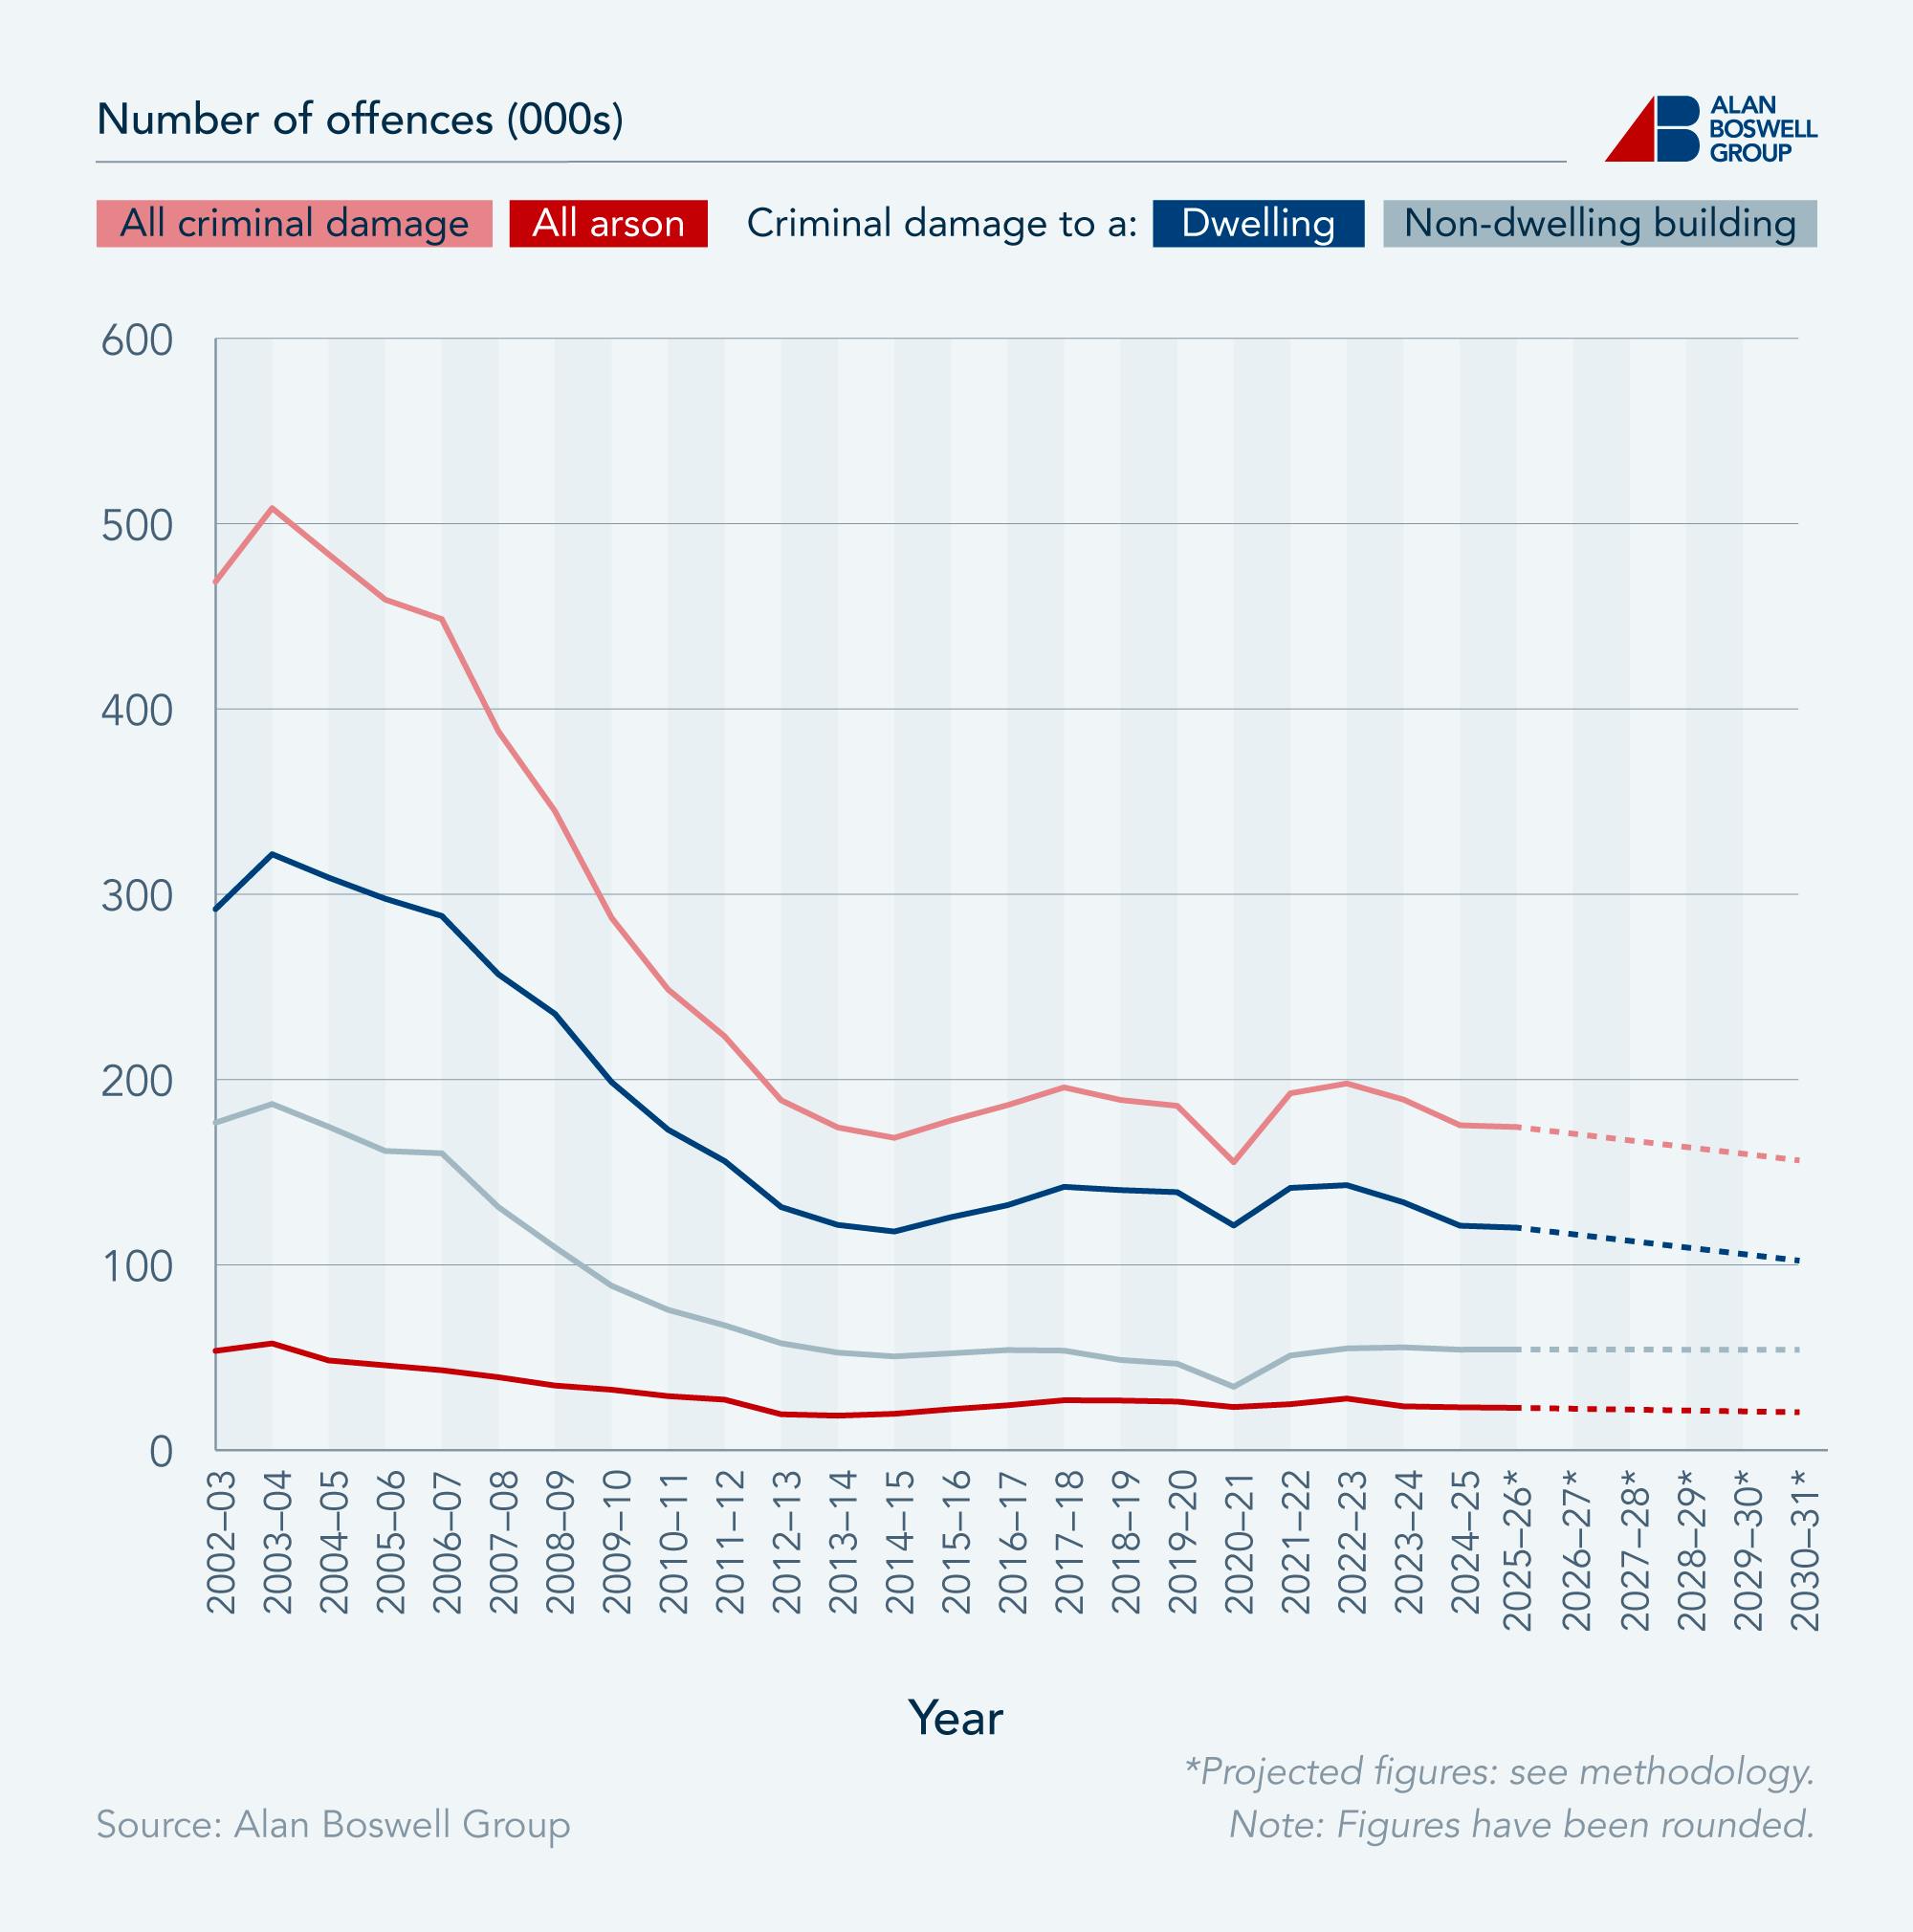
The number of incidents of criminal damage and arson recorded each year
The latest criminal damage UK statistics reveal that, during the 2024-25 financial year, 198,392 arson and criminal damage offences were recorded. This represents a decrease from the previous year across all three classifications:
Arson: -2.25%
Criminal damage to a dwelling: -9.44%
Criminal damage to a non-dwelling building: -2.25%
Number of arson and criminal damage offences recorded each financial year, with forecasting up to 2030-31
|
Year |
All arson |
Criminal damage to a dwelling |
Criminal damage to a non-dwelling building |
All criminal damage |
Total criminal damage and arson |
|---|---|---|---|---|---|
2002-03 |
53,552 |
291,999 |
176,702 |
468,701 |
522,253 |
2003-04 |
57,546 |
321,613 |
186,784 |
508,397 |
565,943 |
2004-05 |
483,68 |
308,973 |
174,489 |
483,462 |
531,830 |
2005-06 |
45,731 |
297,579 |
161,436 |
459,015 |
504,746 |
2006-07 |
43,100 |
288,285 |
160,207 |
448,492 |
491,592 |
2007-08 |
39,327 |
256,804 |
131,146 |
387,950 |
427,277 |
2008-09 |
34,827 |
235,424 |
109,440 |
344,864 |
379,691 |
2009-10 |
32,580 |
198,623 |
88,687 |
287,310 |
319,890 |
2010-11 |
29,116 |
172,916 |
75,677 |
248,593 |
277,709 |
2011-12 |
27,219 |
155,982 |
67,329 |
223,311 |
250,530 |
2012-13 |
19,305 |
131,157 |
57,631 |
188,788 |
208,093 |
2013-14 |
18,582 |
121,525 |
52,599 |
174,124 |
192,706 |
2014-15 |
19,579 |
117,969 |
50,555 |
168,524 |
188,103 |
2015-16 |
22,043 |
125,703 |
52,217 |
177,920 |
199,963 |
2016-17 |
24,157 |
132,188 |
53,985 |
186,173 |
210,330 |
2017-18 |
26,898 |
142,075 |
53,677 |
195,752 |
222,650 |
2018-19 |
26,734 |
140,330 |
48,627 |
188,957 |
215,691 |
2019-20 |
26,164 |
139,206 |
46,603 |
185,809 |
211,973 |
2020-21 |
23,225 |
121,215 |
34,152 |
155,367 |
178,592 |
2021-22 |
24,778 |
141,506 |
51,050 |
192,556 |
217,334 |
2022-23 |
27,819 |
142,980 |
54,876 |
197,856 |
225,675 |
2023-24 |
23,612 |
133,725 |
55,452 |
189,177 |
212,789 |
2024-25 |
23,081 |
121,108 |
54,203 |
175,311 |
198,392 |
2025-26 |
22,799 |
120,049 |
54,313 |
174,362 |
197161 |
2026-27 |
22,325 |
116,485 |
54,276 |
170,761 |
193,086 |
2027-28 |
21,851 |
112,921 |
54,238 |
167,204 |
189,055 |
2028-29 |
21,377 |
109,357 |
54,200 |
163,557 |
184,934 |
2029-30 |
20,903 |
105,793 |
54,163 |
159,956 |
180,859 |
2030-31 |
20,428 |
102,229 |
54,125 |
156,354 |
176,782 |
Source: Alan Boswell Group
Criminal damage to non-dwelling buildings constitutes the majority of criminal damage crimes, representing 69.08% vs 30.92% for dwellings.
Unique forecasting (see methodology) from Alan Boswell Group estimates that, by 2030-31, the total number of arson and criminal damage offences committed annually will have fallen to 176,782 - representing a decrease of virtually two-thirds (66.15%) from 2002.
Which areas record the most instances of criminal damage and arson?
While the majority of the top ten areas with the highest burglary rates are situated in London, this is not the case for criminal damage and arson. The areas with the highest criminal damage and arson rates are spread across England, with seven of the nine English regions represented.
Top ten areas with the highest criminal damage and arson rate
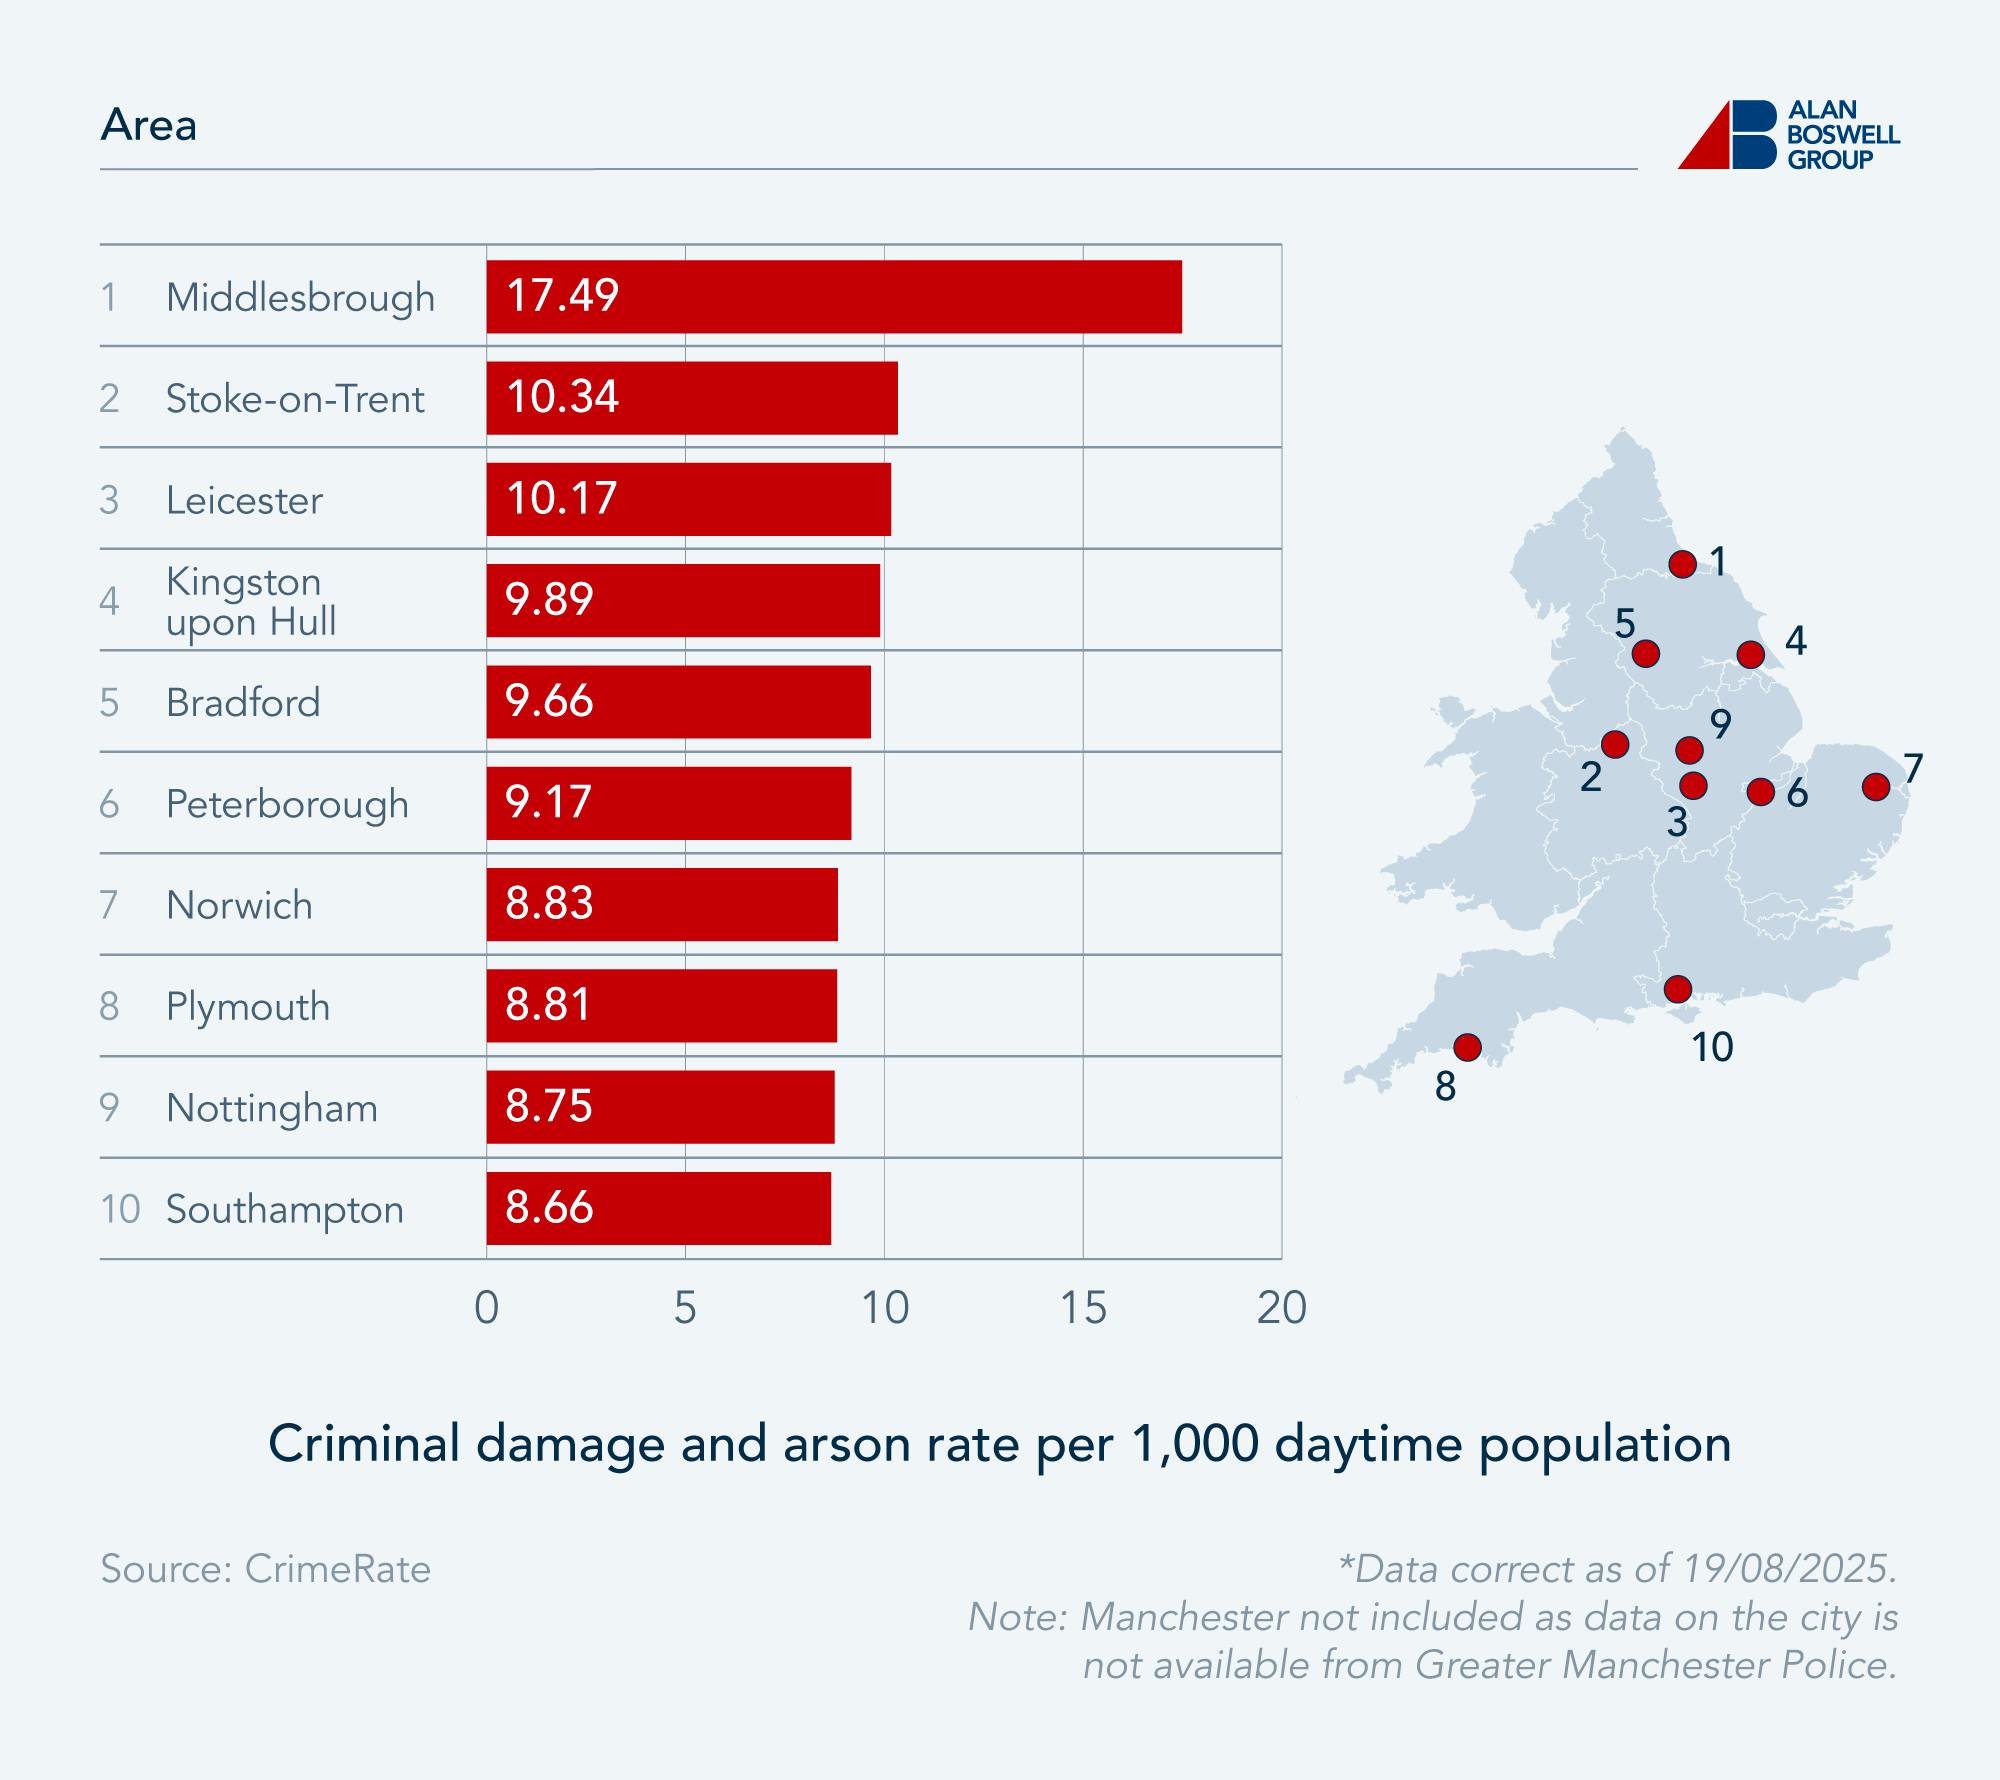
Middlesbrough, in the North East, has the highest burglary rate. At 17.49 per 1,000 population, instances of criminal damage and arson are 69.15% more common here than in Stoke-on-Trent, the West Midlands area in second place. Three areas with the highest criminal damage and arson rate are also among the top ten areas with the highest burglary rate: Middlesbrough, Bradford, and Kingston upon Hull.
Which areas record the fewest instances of criminal damage and arson?
Property crime statistics reveal that all areas with the lowest criminal damage and arson rates can be found in London, with areas ranging from the centre to the outer boroughs.
Top ten areas with the lowest criminal damage and arson rate
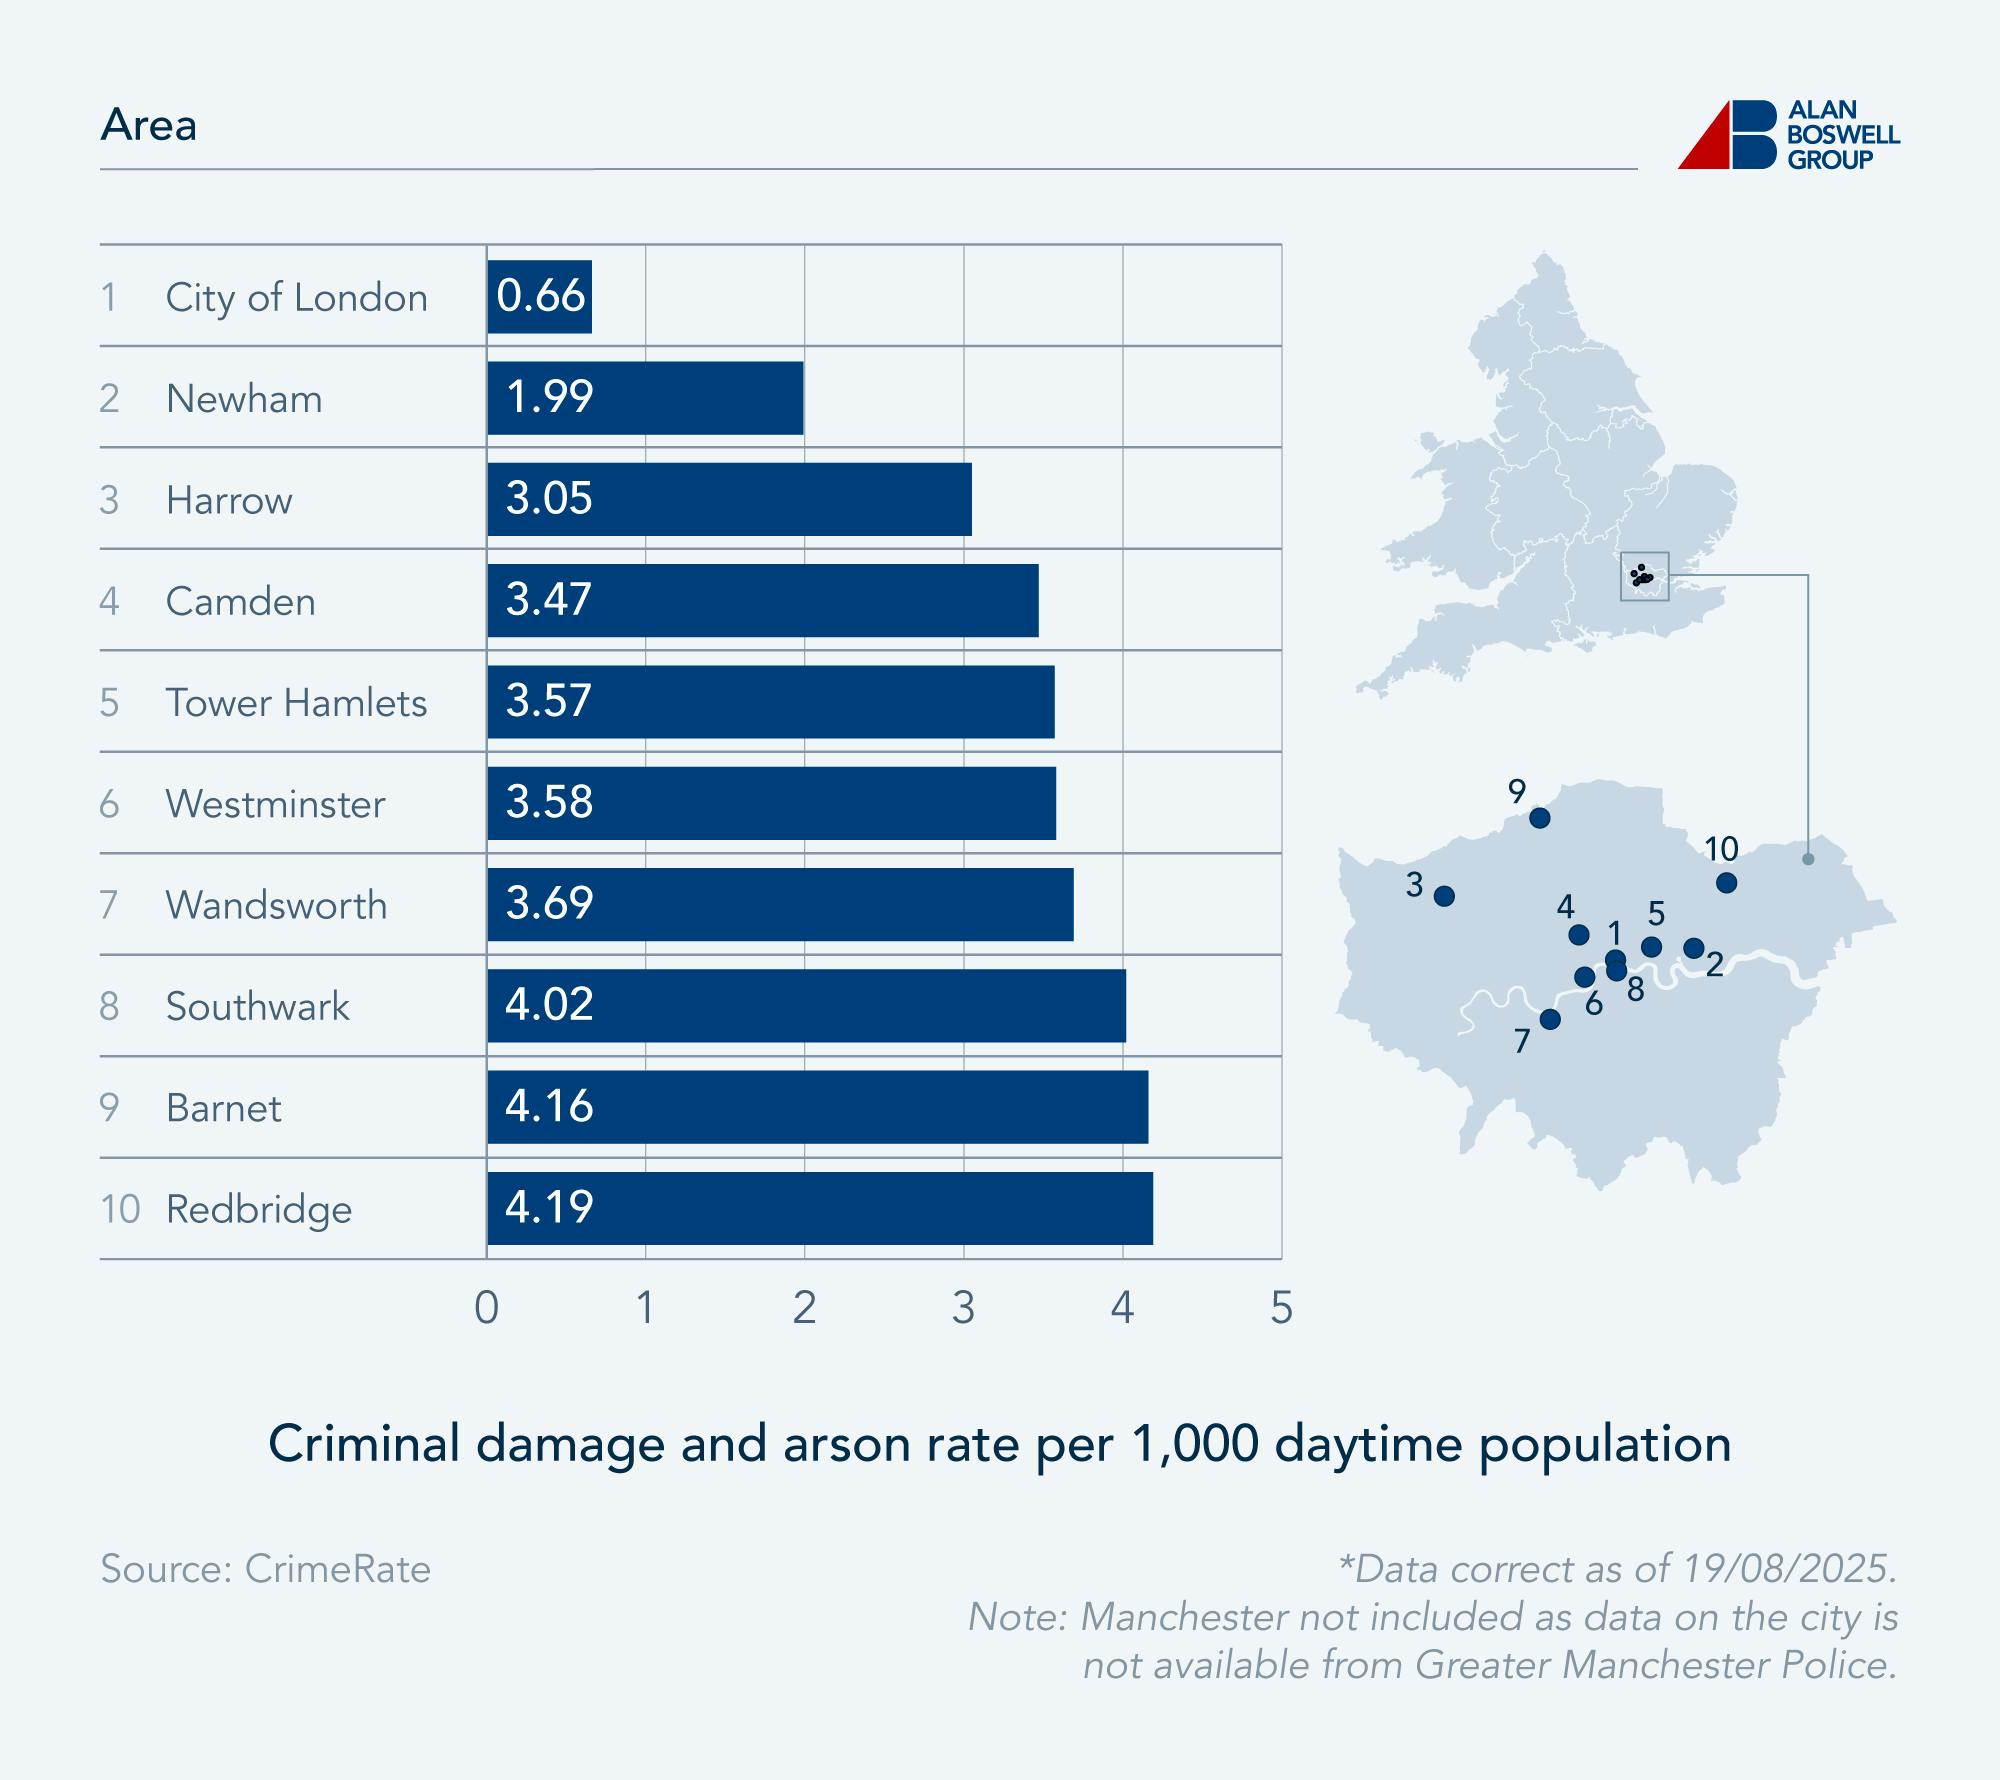
The City of London has the lowest criminal damage and arson rate at just 0.66 offences per 1,000 population. This rate is 96.23% lower than that of Middlesbrough, which is the highest.
When do instances of criminal damage typically occur?
In 2023-24, nearly a quarter of all criminal damage offences occurred during the night. Though this is the most common time for criminal damage to occur, the timing is ten percentage points less common than for burglary.
The most common times for criminal damage to occur
|
Timing |
Apr 2013 to Mar 2014 |
Apr 2014 to Mar 2015 |
Apr 2015 to Mar 2016 |
Apr 2016 to Mar 2017 |
Apr 2017 to Mar 2018 |
Apr 2018 to Mar 2019 |
Apr 2019 to Mar 2020 |
Apr 2022 to Mar 2023 |
Apr 2023 to Mar 2024 |
|---|---|---|---|---|---|---|---|---|---|
Morning (6am-noon) |
6 |
4 |
6 |
6 |
7 |
5 |
7 |
7 |
7 |
Afternoon (noon-6pm) |
11 |
13 |
14 |
15 |
18 |
17 |
14 |
18 |
17 |
Morning/afternoon (unsure which) |
8 |
8 |
7 |
7 |
6 |
7 |
6 |
6 |
7 |
Early evening (6pm-10pm) |
15 |
14 |
16 |
13 |
15 |
17 |
16 |
18 |
18 |
Late evening (10pm-midnight) |
12 |
13 |
11 |
11 |
13 |
10 |
10 |
13 |
12 |
Night (midnight-6am) |
27 |
25 |
27 |
28 |
24 |
23 |
27 |
23 |
23 |
Evening/night (unsure which) |
20 |
22 |
18 |
19 |
17 |
20 |
20 |
16 |
15 |
Daylight |
31 |
30 |
31 |
34 |
34 |
34 |
31 |
34 |
36 |
Dark |
66 |
66 |
66 |
62 |
63 |
62 |
66 |
60 |
59 |
Dawn/dusk |
3 |
4 |
4 |
3 |
3 |
4 |
3 |
6 |
5 |
*Figures may not add up to 100 due to rounding. Note: Data collection suspended between April 2020 and March 2022 due to COVID-19 pandemic. Source: ONS
Almost two-fifths of all criminal damage offences occur during the dark, with over a third occurring during daylight.
The most common days for criminal damage to occur
In regard to what day of the week most criminal damage offences are committed, this type of property crime records the same ratio as burglary, at around 7:3, in favour of weekdays.
However, when considering the length of these time periods (five vs. two days), it is clear that property is more at risk of criminal damage offences on the weekend than during the week.
Between 2013 and 2015, properties were at almost twice the risk of criminal damage on the weekend than during the week. This risk gap then narrowed significantly from 2018-19 onwards, as weekday offences rose.
The latest data for 2023-24 indicates that the criminal damage risk facing property is around 12% higher on weekends than on weekdays.
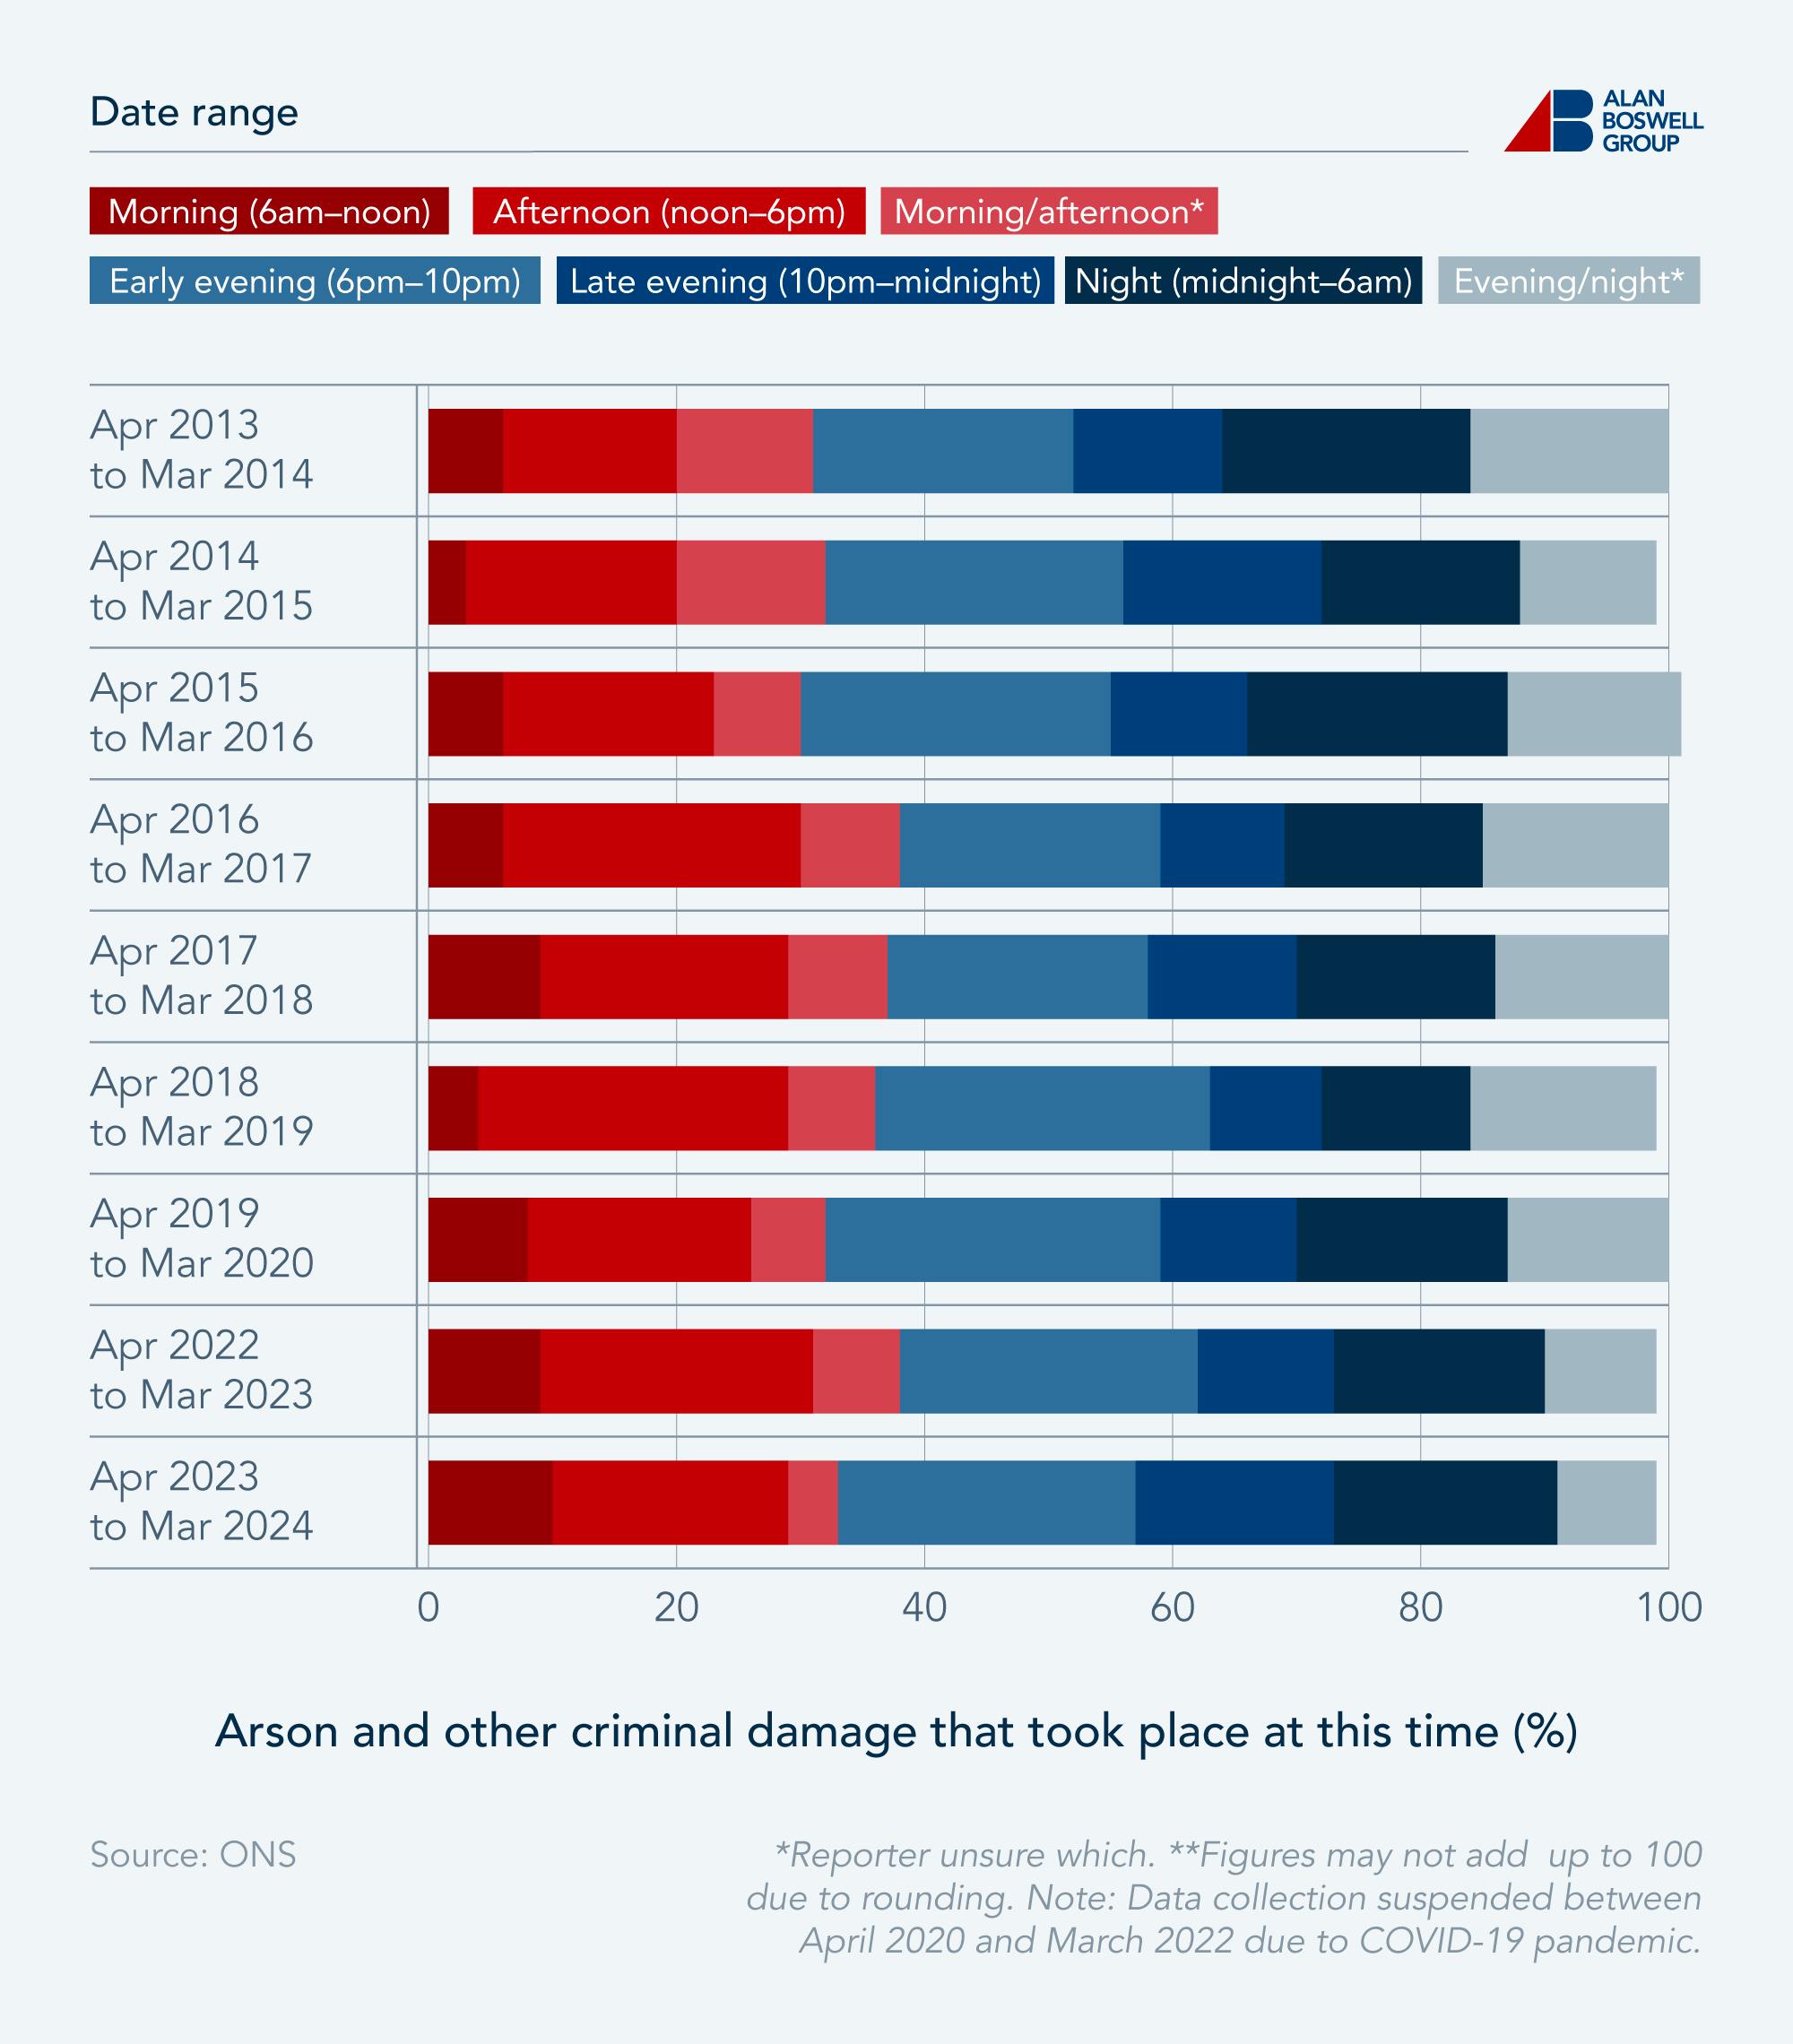
When do instances of arson typically occur?
According to the latest criminal damage and arson statistics, arson and other criminal damage are more likely to occur during the early evening (6pm-10pm), with nearly a quarter of offences in 2023-24 committed during this time.
The most common times for arson and other criminal damage to occur
|
Timing |
Apr 2013 to Mar 2014 |
Apr 2014 to Mar 2015 |
Apr 2015 to Mar 2016 |
Apr 2016 to Mar 2017 |
Apr 2017 to Mar 2018 |
Apr 2018 to Mar 2019 |
Apr 2019 to Mar 2020 |
Apr 2022 to Mar 2023 |
Apr 2023 to Mar 2024 |
|---|---|---|---|---|---|---|---|---|---|
Morning (6am-noon) |
6 |
3 |
6 |
6 |
9 |
4 |
8 |
9 |
10 |
Afternoon (noon-6pm) |
14 |
17 |
17 |
24 |
20 |
25 |
18 |
22 |
19 |
Morning/afternoon (unsure which) |
11 |
12 |
7 |
8 |
8 |
7 |
6 |
7 |
4 |
Early evening (6pm-10pm) |
21 |
24 |
25 |
21 |
21 |
27 |
27 |
24 |
24 |
Late evening (10pm-midnight) |
12 |
16 |
11 |
10 |
12 |
9 |
11 |
11 |
16 |
Night (midnight-6am) |
20 |
16 |
21 |
16 |
16 |
12 |
17 |
17 |
18 |
Evening/night (unsure which) |
16 |
11 |
14 |
15 |
14 |
15 |
13 |
9 |
8 |
Daylight |
40 |
40 |
33 |
50 |
45 |
47 |
42 |
45 |
39 |
Dark |
56 |
54 |
60 |
45 |
53 |
47 |
54 |
48 |
54 |
Dawn/dusk |
4 |
6 |
7 |
5 |
3 |
5 |
4 |
7 |
7 |
*Figures may not add up to 100 due to rounding. Note: Data collection suspended between April 2020 and March 2022 due to COVID-19 pandemic. Source: ONS
In 2013-14, arson was roughly equally likely to occur at night as it was in the early evening, with 20% and 21% of crimes recorded at these times, respectively.
The proportion of arson offences committed in the daylight and in the dark has remained largely unchanged over the last decade.
The most common days for arson and other criminal damage to occur
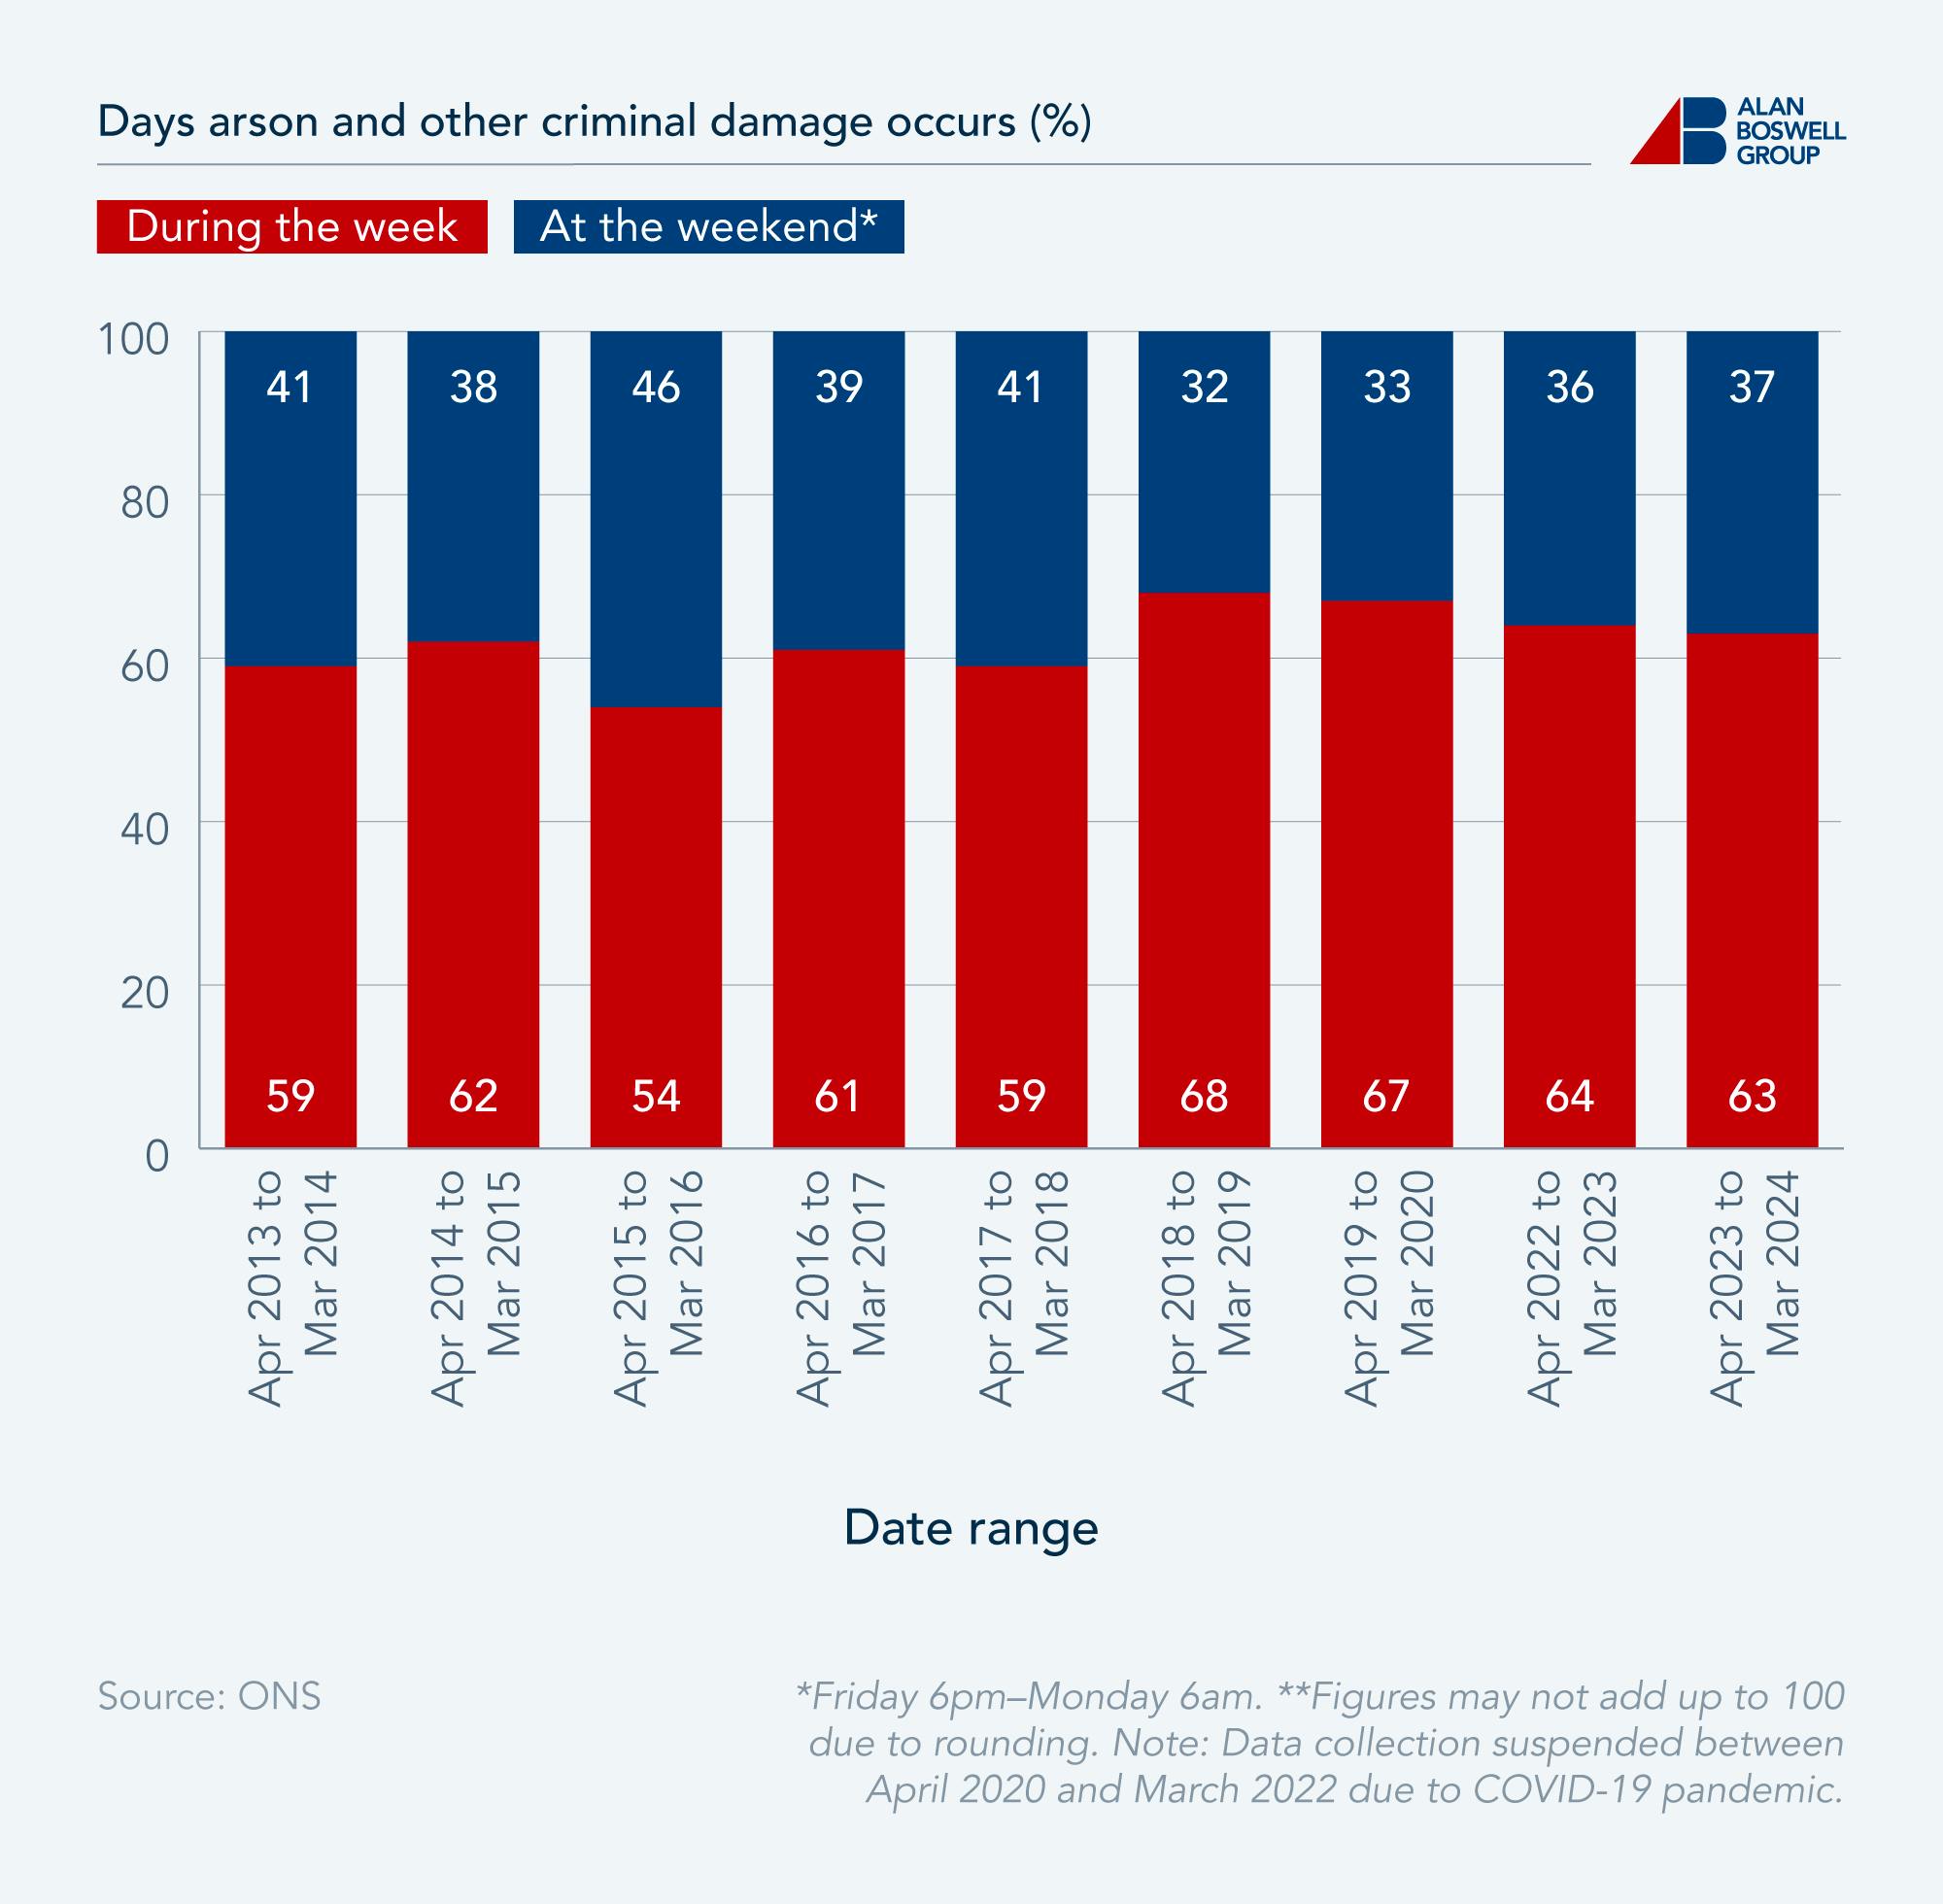
Arson does not record the same days of the week distribution as burglary and criminal damage offences, instead recording 63% of offences on weekdays and 37% on weekends.
The most common types of damage incurred as a result of arson and other criminal damage
In 2023-24, the most common type of criminal damage recorded was a broken wall, fence, or other garden fixture. Despite being the most common form of damage, this is nevertheless down by a quarter (25.81%) from 31% a decade earlier, as revealed by the latest criminal damage and arson statistics.
The most common damage incurred as a result of arson and other criminal damage
|
Type of damage |
Apr 2013 to Mar 2014 |
Apr 2014 to Mar 2015 |
Apr 2015 to Mar 2016 |
Apr 2016 to Mar 2017 |
Apr 2017 to Mar 2018 |
Apr 2018 to Mar 2019 |
Apr 2019 to Mar 2020 |
Apr 2022 to Mar 2023 |
Apr 2023 to Mar 2024 |
|---|---|---|---|---|---|---|---|---|---|
House/flat - window broken |
11 |
9 |
16 |
13 |
20 |
13 |
15 |
9 |
14 |
House/flat - door/lock damaged |
10 |
7 |
7 |
6 |
8 |
10 |
9 |
8 |
9 |
House/flat - soiling |
3 |
2 |
5 |
3 |
4 |
5 |
3 |
5 |
5 |
House/flat - graffiti |
5 |
6 |
9 |
3 |
3 |
6 |
7 |
7 |
4 |
House/flat - other criminal damage |
15 |
11 |
16 |
12 |
21 |
13 |
17 |
18 |
9 |
Wall/fence/other garden - broken |
31 |
34 |
28 |
27 |
20 |
25 |
28 |
24 |
23 |
Wall/fence/other garden - graffiti |
7 |
9 |
6 |
6 |
4 |
6 |
7 |
5 |
13 |
Wall/fence/other garden - other |
5 |
5 |
4 |
7 |
9 |
6 |
9 |
6 |
5 |
Shed/garage - door/lock damaged |
1 |
1 |
2 |
2 |
1 |
2 |
1 |
1 |
2 |
Shed/garage - graffiti |
2 |
1 |
3 |
4 |
1 |
2 |
1 |
3 |
1 |
Shed/garage - other |
0 |
2 |
2 |
2 |
3 |
2 |
2 |
3 |
1 |
Shed/garage - window broken |
1 |
0 |
1 |
0 |
1 |
0 |
1 |
3 |
1 |
Shed/garage - soiling |
0 |
0 |
1 |
0 |
0 |
0 |
0 |
0 |
0 |
Other criminal damage |
20 |
20 |
22 |
22 |
22 |
21 |
20 |
29 |
23 |
Note: Data collection suspended between April 2020 and March 2022 due to COVID-19 pandemic. Source: ONS
Within the house itself, the most common form of damage recorded in arson and criminal damage cases is broken windows, seen in around one in seven cases.
If you are a landlord with buy-to-let insurance, you may be covered for fire damage to your property incurred as a result of arson.
Property flood risk statistics
Flood risk report: How many properties are at risk of flooding from rivers and the sea?
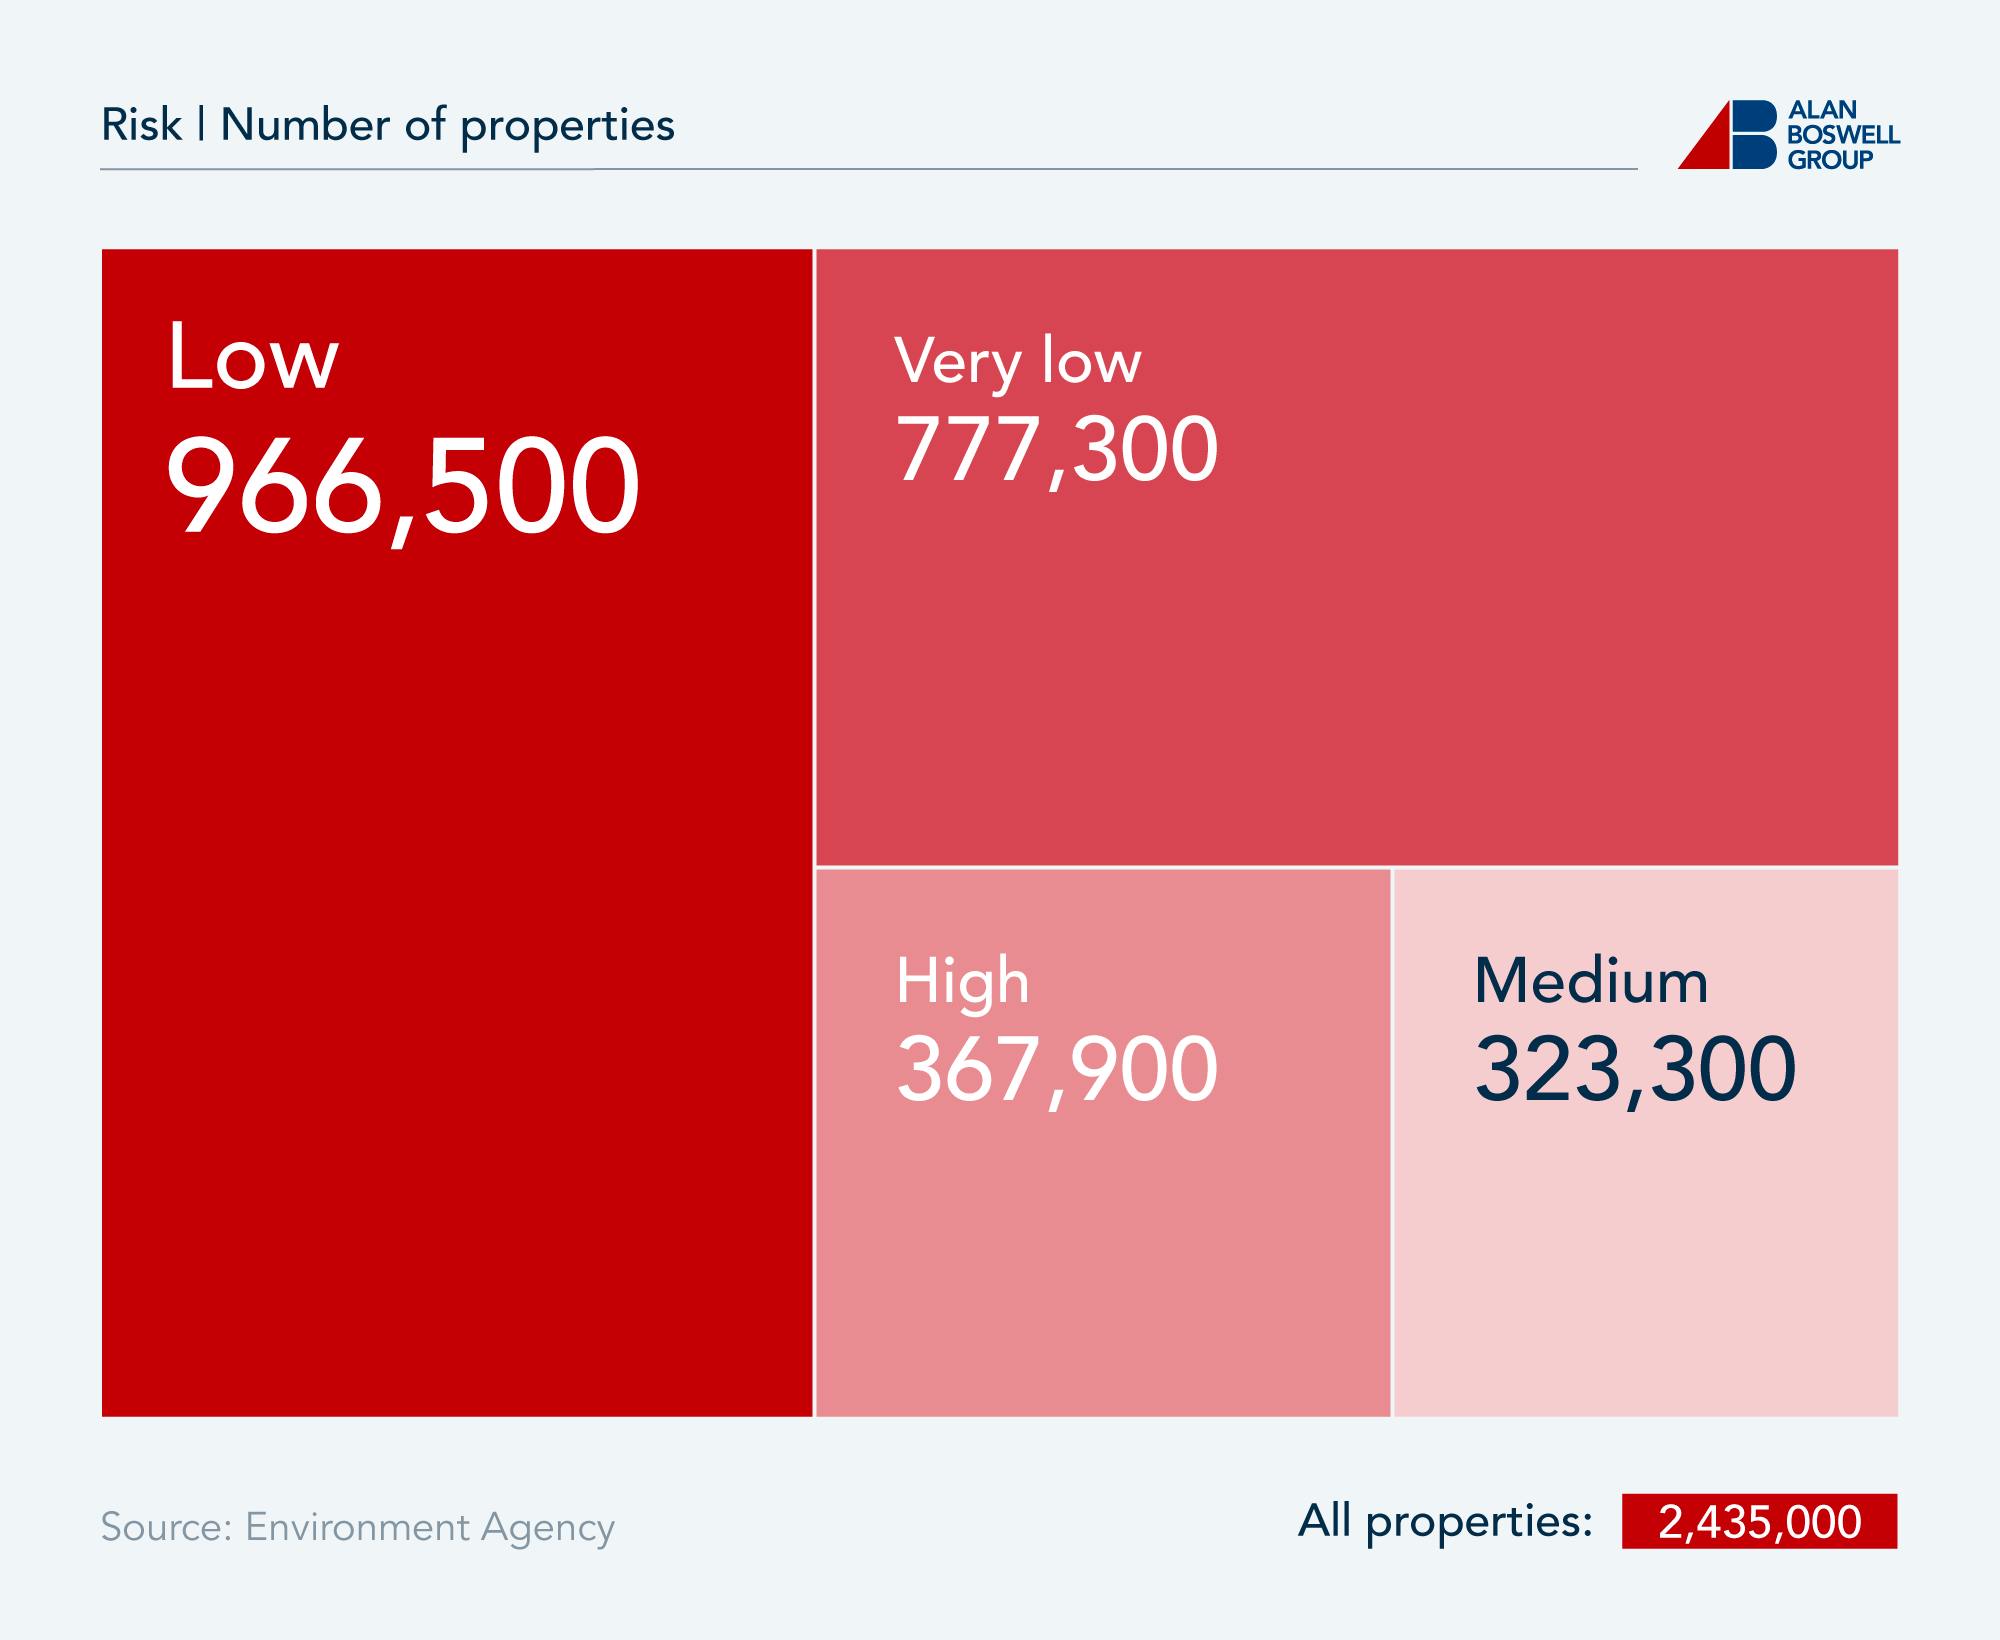
According to the latest flood statistics, as of 2024, 2,435,000 English properties are at risk of flooding from rivers and the sea, accounting for 9.5% of all dwellings in England (25,620,000).
The Environment Agency (EA) categorises 368,000 of these properties as being at high risk of river and coastal flooding, equivalent to 15.11% of properties at any risk, and 1.44% of the total dwelling stock in England.
The number of properties in areas at risk of flooding from rivers and the sea
The Environment Agency’s current risk measurement is an improvement on their previous assessment, and while these figures are not directly comparable due to differing methodologies, the EA nevertheless notes that the 368,000 properties at high risk of coastal and river flooding are an 87.6% increase on previous estimates published by the Environment Agency in 2023-24.
Of the 2.4 million properties at risk of this type of flooding, the majority (39.7%) are classified as being in low-risk areas.
Number of properties in areas at risk of flooding from rivers and the sea, with climate change between 2036 and 2069
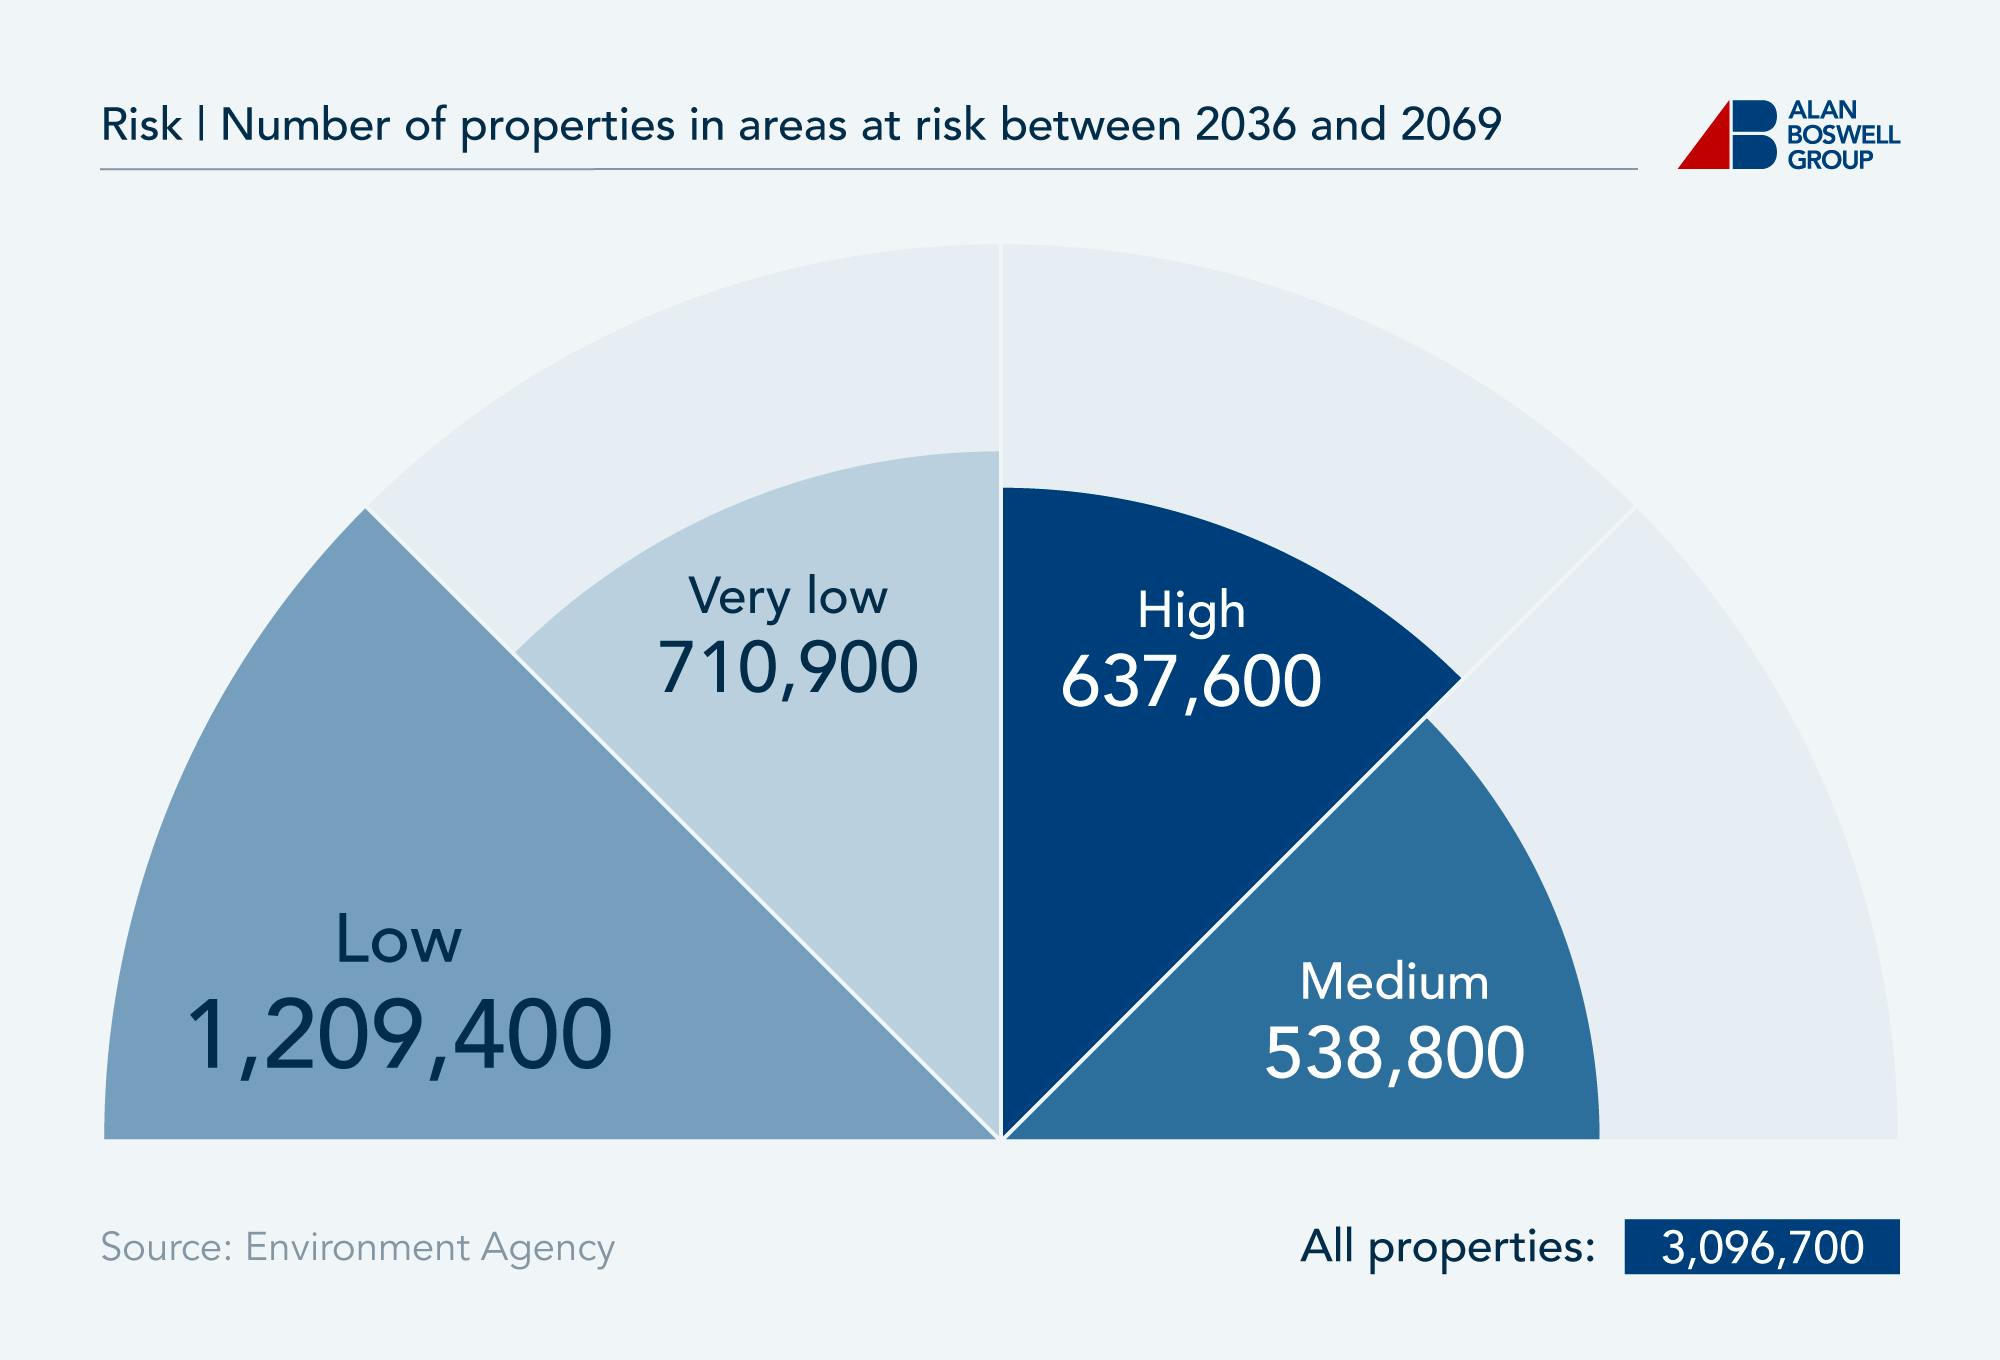
When accounting for climate change, the EA predicts that nearly 638,000 properties will be in high-risk coastal and river flooding areas between 2036 and 2069. This represents a 73.31% increase from the number of properties currently classified as high-risk.
Anticipated depth of flooding in areas at medium and high risk of flooding from rivers and the sea
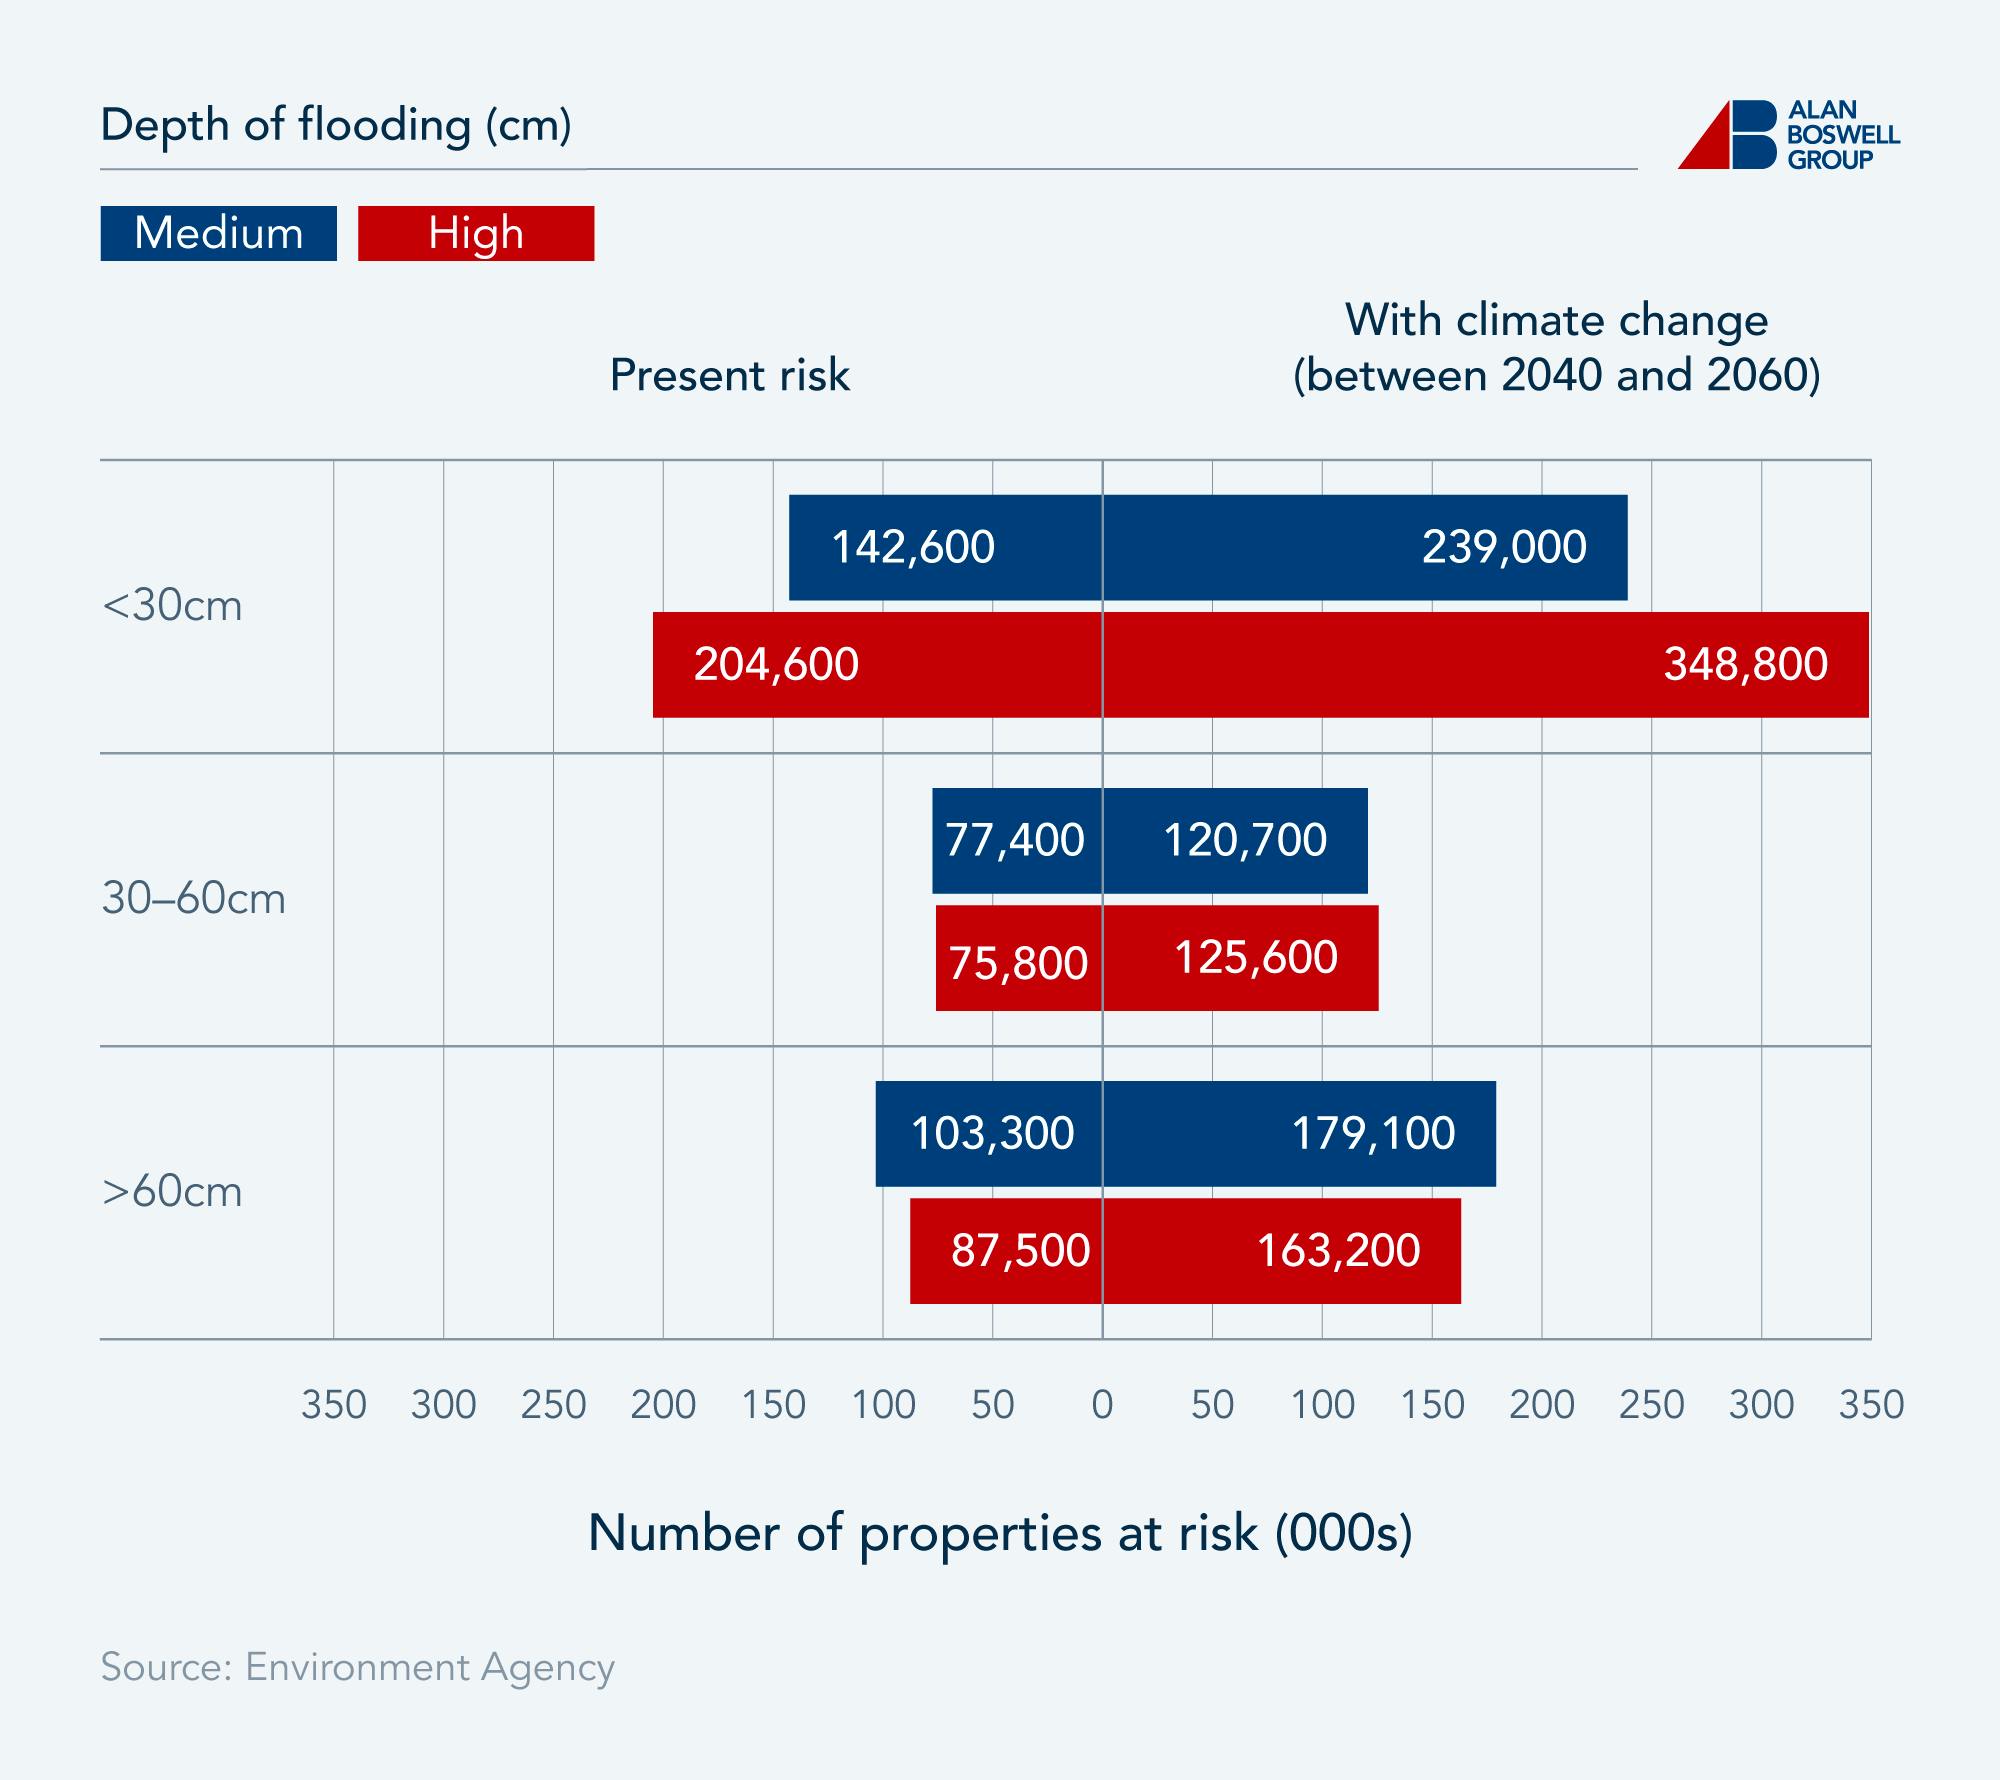
Using the current estimates, nearly 205,000 properties in England classed as high-risk are likely to flood to depths of 30cm or less. However, when considering the impact of climate change, this figure is expected to rise by 70.48% to nearly 349,000 between 2036 and 2069.
87,500 properties at high-risk of river and coastal flooding are currently likely to flood to depths of 60cm or more, with this figure rising by 86.51% to over 163,000 properties between 2036 and 2069 as a result of climate change.
Flood risk report: How many properties are at risk of flooding from surface water?
The number of properties in areas at high risk of flooding from surface water is far higher than those at risk of coastal and river flooding, as a result of the over-development of urban centres.
The number of properties in areas at risk of flooding from surface water
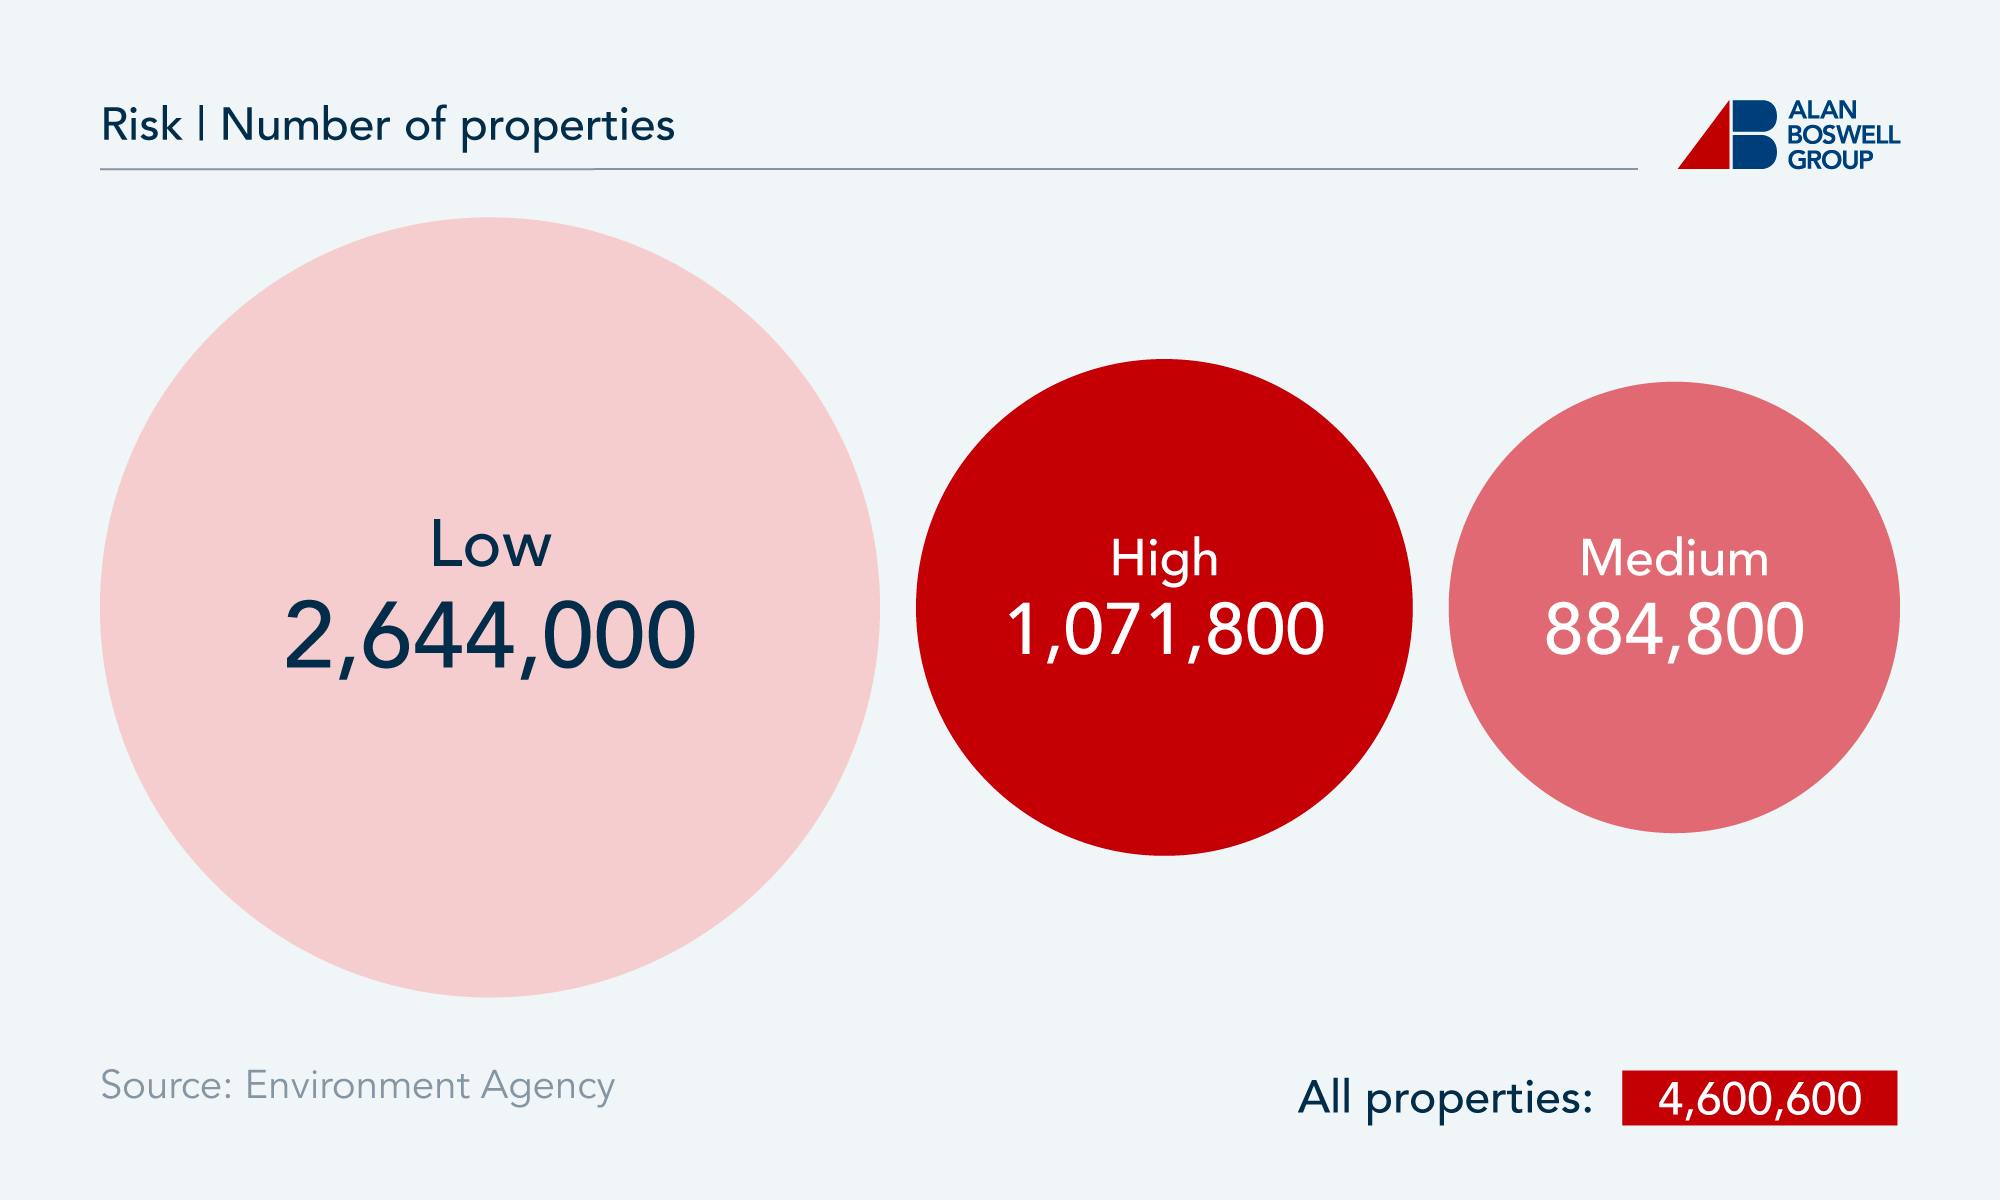
Flood statistics reveal that over 1.07 million properties in England are currently classed as high-risk, representing a fifth (20.6%) of all properties at risk of surface water flooding. This is a rise in the estimate of nearly three-quarters (73.3%) from the EA’s previous flood modelling.
The number of properties in areas at risk of flooding from surface water, with climate change between 2040 and 2060
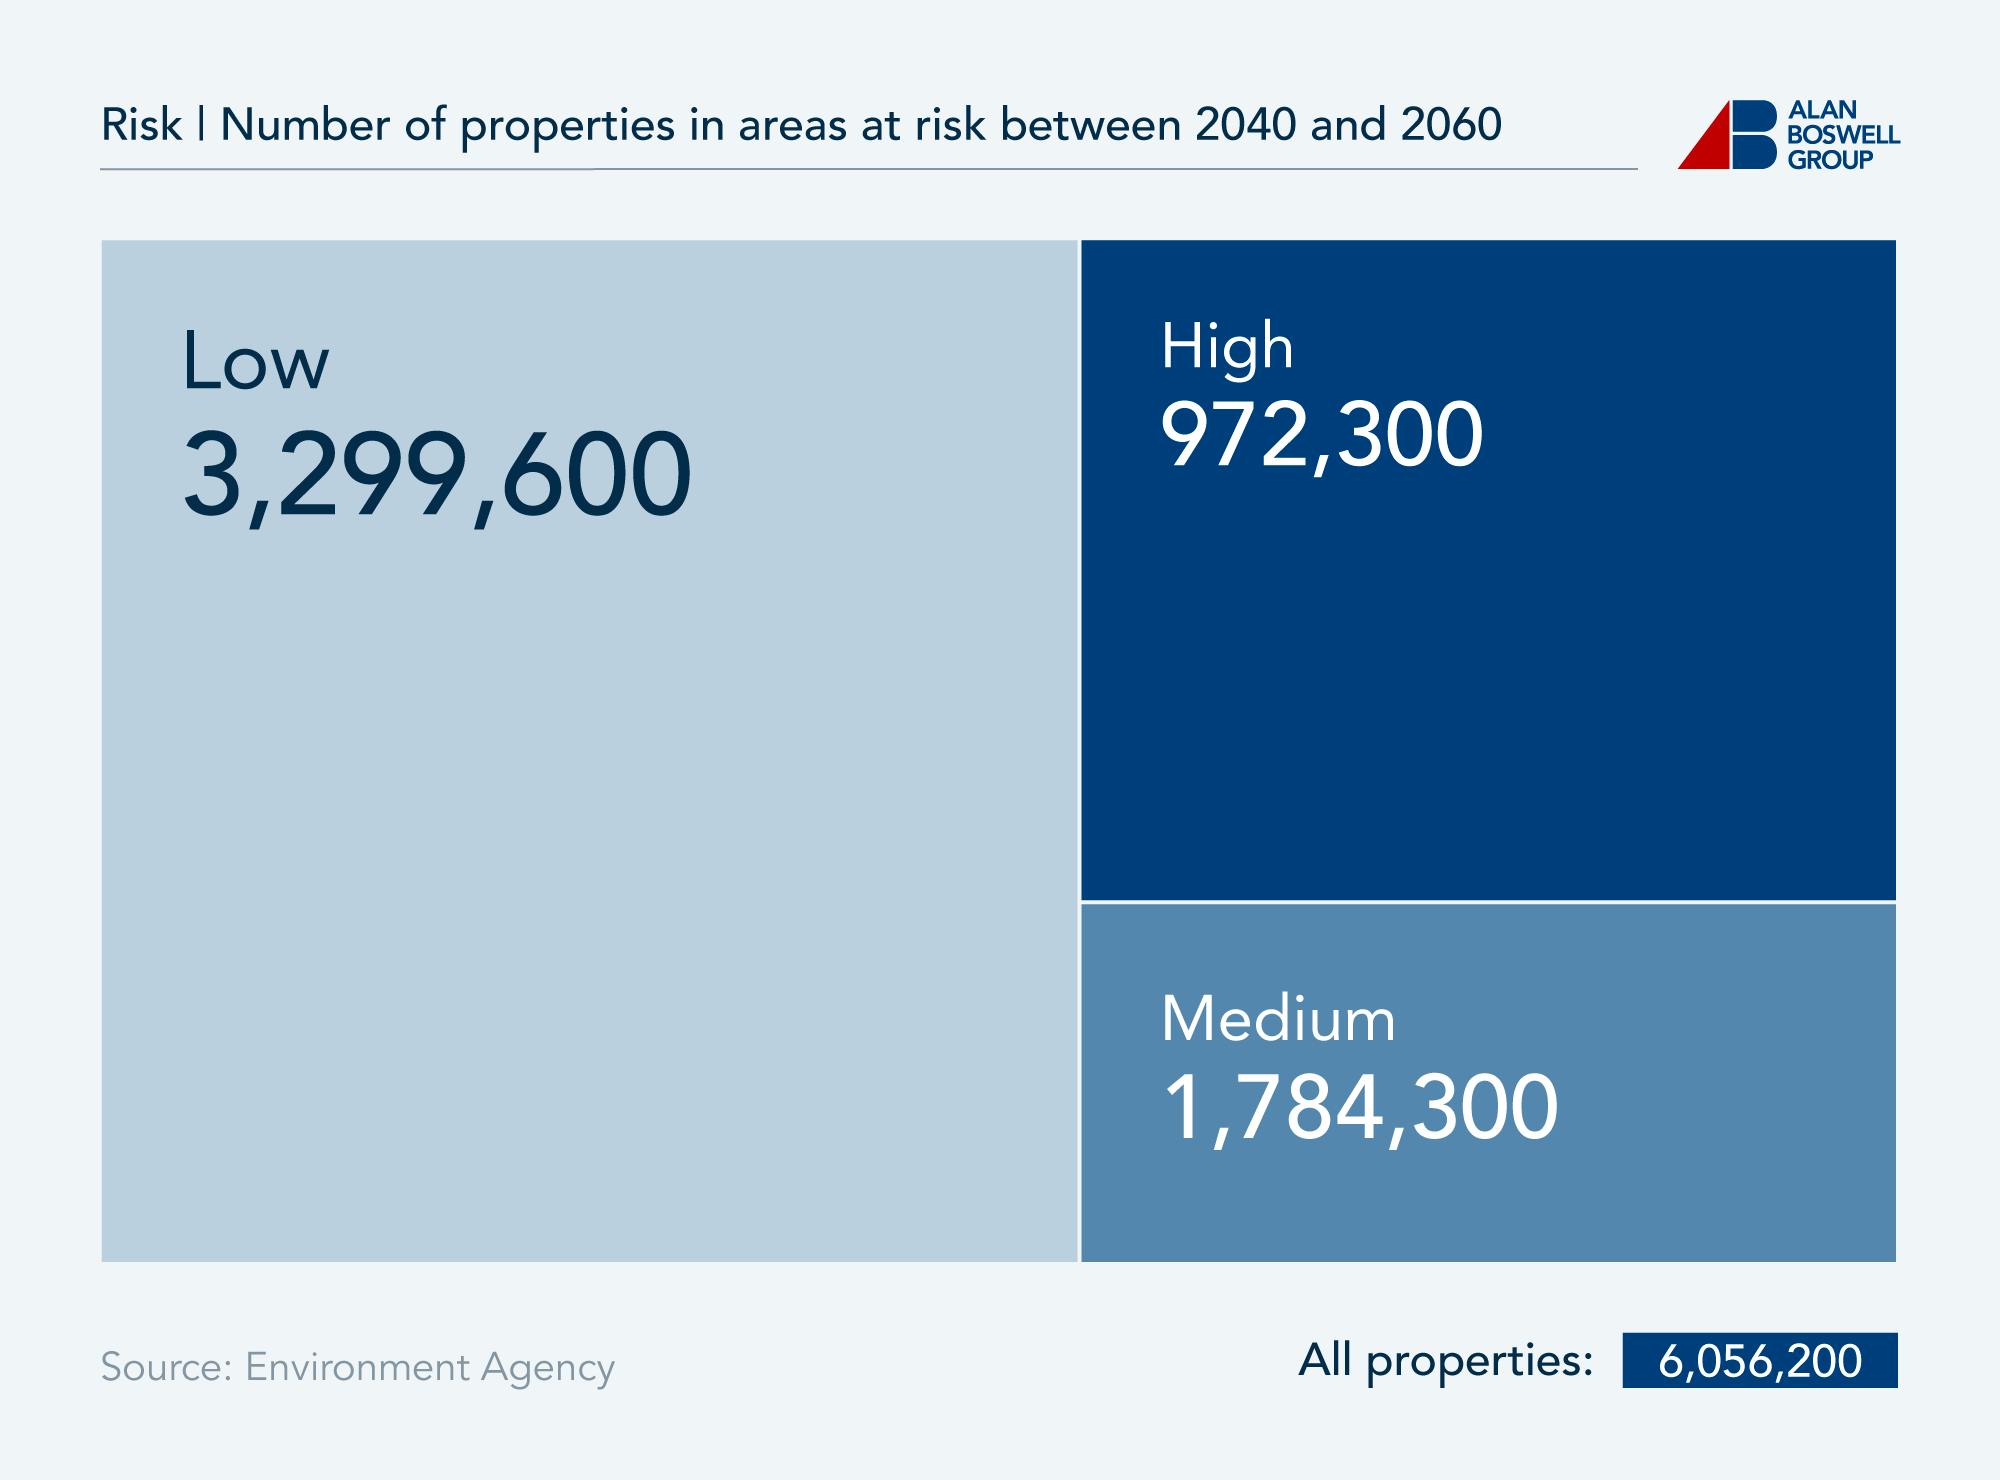
When considering the impact of climate change, the EA predicts that, by 2040-60, over 1.784 million properties could be in areas at high risk of surface water flooding. This is a staggering predicted rise of 179.85% from the number of properties currently classed as high-risk.
Anticipated depth of flooding in areas at medium and high risk of flooding from surface water
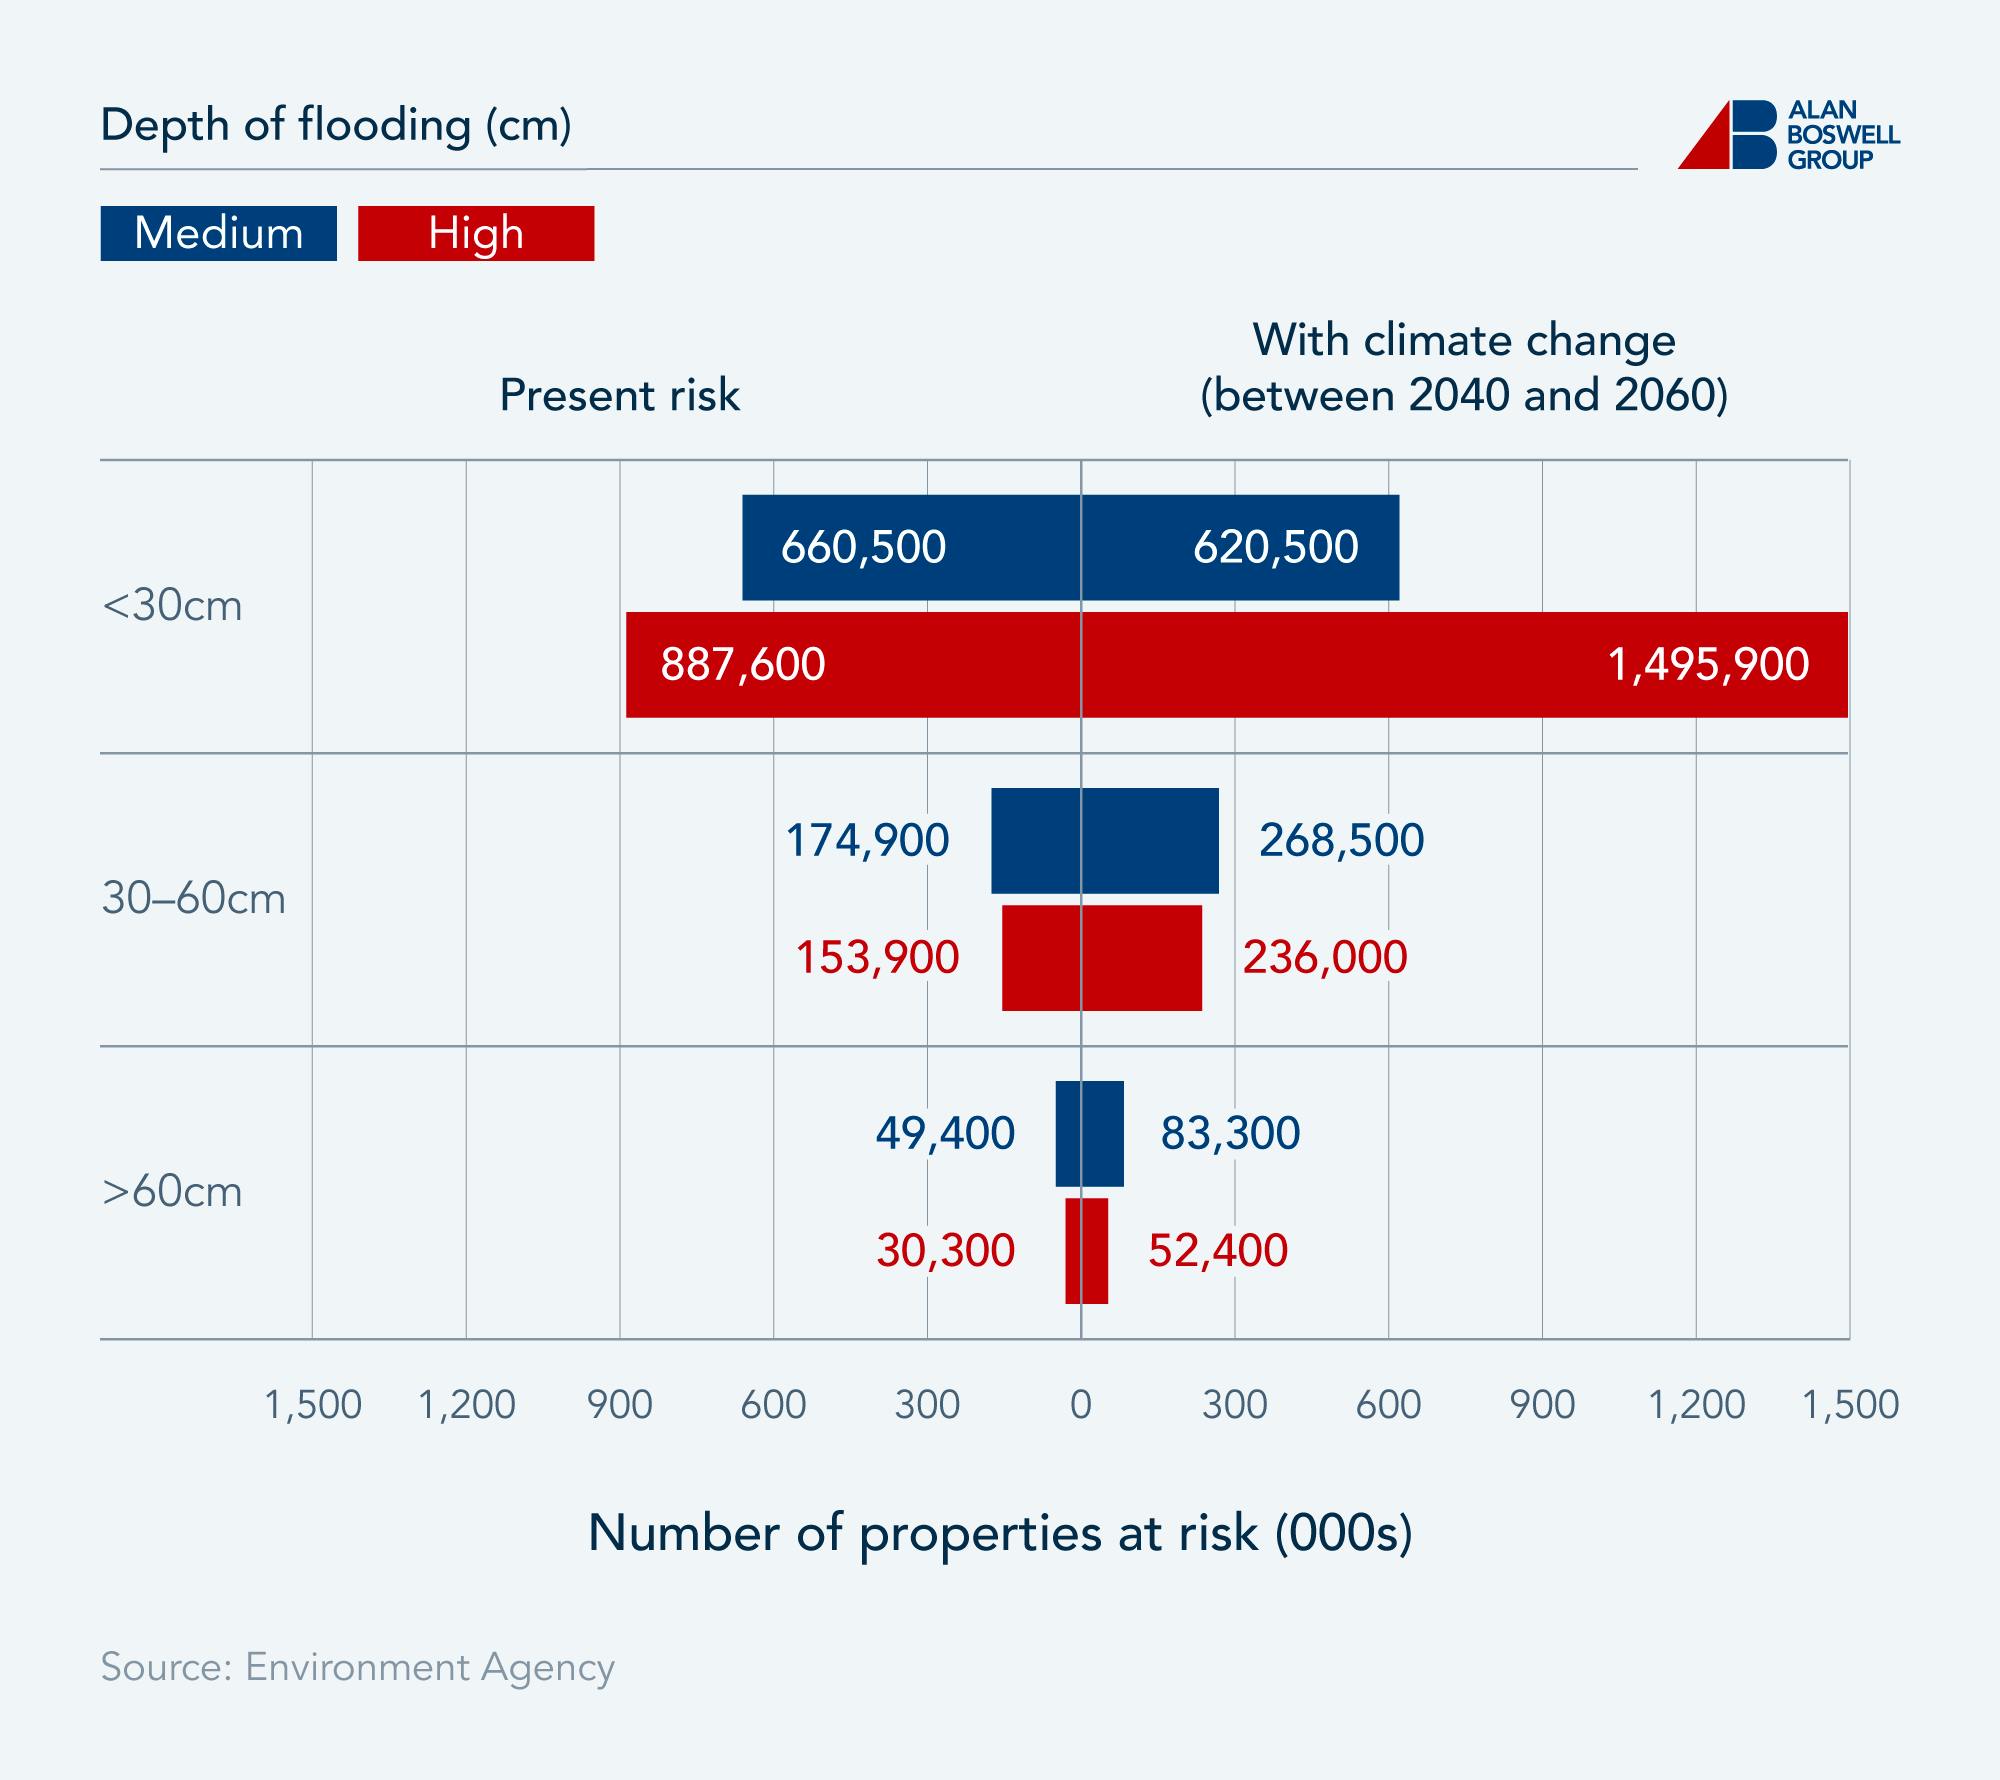
Nearly 888,000 properties in high-risk surface flooding areas are likely to face flooding up to 30cm in depth, with this figure expected to rise by 68.53% to nearly 1.496 million between 2040 and 2060 when accounting for climate change.
Property flood risk data indicates that, currently, 30,300 properties in high-risk areas are vulnerable to flooding of over 60cm in depth. When considering climate change, this figure is predicted to rise by 72.94% to 52,400 by mid-century (2040-2060).
As a landlord, if your tenants need to temporarily move out of your property due to flooding, landlord insurance will cover your loss of rental income or alternative accommodation costs for your tenants.
Future flood risk map UK
Across England, properties in the East Midlands are at the greatest risk of flooding from rivers and the sea.
The 127,500 properties in medium to high-risk areas represent nearly one in 20 (4.6%) buildings in the region. Further, East Midlands properties at risk of coastal and river flooding represent nearly a fifth (18.4%) of all properties facing this flooding in England.
Regional distribution of properties in areas at medium to high risk of flooding from rivers and the sea
The North East has the fewest properties vulnerable to river and coastal flooding. Just 0.9% of properties in the region are in medium to high-risk areas, and the 13,000 buildings equate to just 1.9% of the country’s vulnerable properties.
Regional distribution of properties in areas at medium to high risk of surface water flooding
London records the most properties at risk of surface water flooding. The capital’s hugely built-up land area means that 27.8% of all properties are at risk of flooding due to surface water. The 544,000 vulnerable properties in the city represent 12.6% of England’s total property stock at risk of surface flooding.
Along with being the least vulnerable region to coastal and river flooding, the North East also has the fewest buildings at medium to high-risk of surface water flooding.
Property subsidence statistics
How many properties are at risk of subsidence?
In 2024, the British Geological Survey (BGS) reported that 4.5 million homes in England were at risk of subsidence.
Climate extremes are behind some of the leading causes of subsidence, including flooding, which washes away the soil around property foundations, and high temperatures, which cause soil to shrink in volume, impacting its ability to support foundations.
With these climate factors in mind, LexisNexis analysis of the BGS data suggests that, by 2050, more than 5.7 million properties in England could be at risk of subsidence. This is a 27% increase on current estimates.
The economic impact of subsidence
The BGS estimates that shrink-swell in clay soils, one of the leading causes of subsidence, costs the economy over £400 million a year.
With climate change continuing to exacerbate this process, these shrink-swell events are set to increase by 50% by 2040, with the UK economy paying £600 million each year by 2050 as a result.
Subsidence insurance claims
The Association of British Insurers (ABI) revealed that, in the first six months of 2025 alone, insurers paid out £153 million in subsidence-related claims to UK households.
All four UK nations experienced above-average temperatures this spring, with the Met Office reporting that it was the UK’s warmest spring on record. With these temperatures exacerbating soil shrinkage, the ABI revealed that insurers supported almost 9,000 homes with subsidence-related claims, with an average payout per claim of £17,264.
How much are subsidence repair costs?
The latest price analysis from Checkatrade revealed that the average cost of underpinning to rectify subsidence is £12,500. This is equivalent to around 22 weeks of average UK household expenditure.
Price range and average cost of subsidence repairs
|
Subsidence repair costs |
Cost + VAT (Range: low - high) |
Average cost |
|---|---|---|
Underpinning |
£10,000 - £15,000 |
£12,500 |
Underpinning cost per m (up to 1m) |
£1,000 - £1,400 |
£1,200 |
Mass concrete method (per m) |
£300 - £500 |
£400 |
Piling (per pile) |
£750 - £1,250 |
£1,000 |
Injection method (per m²) |
£400 - £700 |
£550 |
Beam and base method (per m²) |
£500 - £900 |
£700 |
Structural engineer (hourly rate) |
£80 - £120 |
£100 |
Survey |
£625 - £1,725 |
£1,175 |
Party Wall Agreement |
£1,500 - £2,100 |
£1,800 |
Source: Checkatrade
A subsidence survey, typically required by insurers for properties in high-risk areas, is likely to set property owners back £1,175 on average. This further depends on the scale of your property, as the average hourly rate for a structural engineer is an additional £100.
Future subsidence risk
Subsidence surge years are those in which there has been a significant increase in subsidence-related claims. Geobear, a ground engineering company, suggests that these surge years correlate with years that include prolonged dry spells, leading to soil shrinkage.
Historical surge years are:
2003
2006
2010
2011
2018
2022
In analysing the climate patterns of past surge years, including the ENSO climate phenomenon, Geobear has made predictions as to when the next surge years may occur, indicating greater subsidence risk.
Predicted subsidence surge years
Year |
Predicted ENSO phase |
Risk factor |
|---|---|---|
2027 |
Strong La Niña developing |
Medium-high risk: La Niña could cause persistent summer dryness |
2030 |
El Niño developing |
High risk: UK is likely to see very warm and dry conditions, similar to 2003 and 2018 |
2033 |
La Niña weakening to neutral |
Medium risk: Dry summer possible if preceded by a cold winter. |
Source: Geobear
FAQs
If neither your property nor the local area has a history of subsidence, your building insurance should cover subsidence - though due to the serious nature of the problem, the excess is likely to be high.
If your property is situated in an area deemed high-risk for subsidence, insurers may still offer you cover, but they will likely charge a higher premium due to the increased risk. Some providers may refuse to offer cover or may exclude subsidence from your policy.
Unlike with other types of insurance, such as car insurance claims following an accident, subsidence does not have a finite period during which you must inform your insurer. Instead, subsidence is something you will always be expected to declare to your provider.
When switching providers, you may be asked for an up-to-date structural engineer’s report before the insurer will agree to provide cover. However, if it’s been over ten years since your property experienced subsidence, the insurer may not require an engineer’s report.
For more information, read our property owners’ guide to subsidence.
The steps you need to take after identifying subsidence depend on the root cause and severity of the problem.
If a surveyor identifies trees on your property whose roots are drawing moisture out of the soil underneath your building, they will recommend that you cut these back or remove them altogether.
Similarly, if the cause of your subsidence is excess water under the property as a result of leaking pipes, you will need to get your pipework fixed.
If the subsidence on your property is aggressive, your home may need to be underpinned. This is where the soil beneath your property is replaced with materials that won’t erode in order to restore a solid foundation. This process comes at a price, with data from Checkatrade indicating that the average cost of underpinning in 2025 is £12,500.
Yes, home insurance policies typically cover storm damage to your property; however, the level of damage covered will vary by policy.
For your property to be covered for any damage caused by a storm, insurers require that wind speeds reach a minimum of 56mph.
Landlords can protect their properties against storm damage with a landlord building insurance policy, and it’s advised to also make use of landlord home emergency cover. The latter policy will help arrange emergency repairs to your rental property in the case of damage as a result of fallen trees.
The key principles of preventing burglary are making your property less attractive to burglars and ensuring that criminals do not have easy access to your home.
Some top tips to prevent burglary are:
Keep all valuables away from windows so that they are not easily spotted from the street.
Install lights on automatic sensors, both inside and outside the property, if possible.
Ensure all doors have robust locks and are kept locked at all times, even when you are home.
Never leave windows open when you are away from the property, and avoid leaving them open at night, even when you are home.
If you have a garden, ensure that your gates and fencing are secure, and never leave valuable tools out.
Glossary
Subsidence
Subsidence is the gradual sinking of the ground beneath a property, causing the foundations of the building to shift and leading to cracks in walls, uneven floors, and structural instability.
Subsidence often occurs when the soil beneath a property loses moisture and shrinks, which is common in clay-rich soils during dry weather.
Surface water flooding
Surface water flooding occurs when heavy rainfall overwhelms the local drainage systems and water collects on the ground, unable to drain away quickly enough. Unlike river or coastal flooding, surface water flooding happens away from water bodies and is typically caused by intense rainfall over a short period of time.
Methodology and sources
Forecasted burglary, criminal damage and arson data
Alan Boswell Group set out to forecast data on burglaries, criminal damage and arson offences in England and Wales, to predict the risk facing property owners.
To do so, data was collected from the Office for National Statistics’ Crime in England and Wales report.
Note: Criminal damage and arson totals exclude data on racially or religiously motivated criminal damage and arson.
For burglary and total arson forecasts, a log-linear regression approach was applied to forecast annual crime values for each sub-category from 2025 to 2030.
Crime data tends to follow exponential or decaying trends over time and has been predicting negative values for years after 2025. Therefore, the linear regression was performed on the log-transformed values, and the forecasted results were exponentiated to return to the original scale.
For all other metrics in arson forecasts, Holt's linear exponential smoothing was used. These series often demonstrate steady declines or slight recoveries. Holt’s method captures both the level and trend without overreacting to short-term noise.
Source: Table A5a from the March 2025 edition of this dataset: https://www.ons.gov.uk/peoplepopulationandcommunity/crimeandjustice/datasets/crimeinenglandandwalesappendixtables |
https://www.ons.gov.uk/peoplepopulationandcommunity/crimeandjustice/datasets/crimeinenglandandwalesappendixtables#:~:text=Year%20ending%20December%202024%20edition%20of%20this%20dataset |
https://crimerate.co.uk/burglary |
https://www.ons.gov.uk/peoplepopulationandcommunity/crimeandjustice/datasets/natureofcrimeburglary |
https://www.ons.gov.uk/peoplepopulationandcommunity/crimeandjustice/datasets/focusonpropertycrimeappendixtables |
https://crimerate.co.uk/criminal-damage-arson |
https://www.ons.gov.uk/peoplepopulationandcommunity/crimeandjustice/datasets/natureofcrimecriminaldamage |
https://www.floodre.co.uk/protect-against-floods-or-risk-market-instability-warns-outgoing-flood-re-chair/?utm_source=rss&utm_medium=rss&utm_campaign=protect-against-floods-or-risk-market-instability-warns-outgoing-flood-re-chair |
https://www.groundsure.com/climate-change-how-big-is-the-risk-to-property/ |
https://consult.defra.gov.uk/floods-and-water/reforming-our-approach-to-floods-funding/ |
https://www.gov.uk/government/publications/national-assessment-of-flood-and-coastal-erosion-risk-in-england-2024/national-assessment-of-flood-and-coastal-erosion-risk-in-england-2024 |
https://check-long-term-flood-risk.service.gov.uk/postcode |
https://www.luciongroup.com/news/subsidence-a-growing-threat-to-uk-properties/ |
https://www.bgs.ac.uk/datasets/property-subsidence-assessment/ |
https://www.checkatrade.com/blog/cost-guides/subsidence-repair-costs/ |
https://www.postonline.co.uk/news/7953797/subsidence-costs-to-increase-800-if-climate-change-continues-at-current-rate |
https://www.bgs.ac.uk/news/property-subsidence-assessment-helping-to-mitigate-shrink-swell-hazard-risk/ |
https://www.theguardian.com/money/2023/aug/28/heat-extreme-weather-uk-insurance-costs-subsidence |
https://www.hippo.com/blog/hippo-heat-wave-survey |
https://www.abi.org.uk/news/news-articles/2025/2/more-action-needed-to-protect-properties-as-adverse-weather-takes-record-toll-on-insurance-claims-in-2024/ |
https://www.abi.org.uk/news/news-articles/2024/112/year-to-date-property-claims-payouts-hit-4.1-billion/ |
https://www.abi.org.uk/news/news-articles/2024/4/weather-damage-insurance-claims-worst-on-record/ |
https://risk.lexisnexis.co.uk/about-us/press-room/press-release/20240924-geospatial-risks |
https://www.abi.org.uk/news/news-articles/2025/7/insurance-support-tops-150-million-for-homes-affected-by-subsidence/ |
https://www.geobear.co.uk/2025-a-subsidence-surge-event-year/ |
Related guides and insights

Commercial Property Statistics 2025
The latest commercial real estate statistics for 2025, including the average percentage yield on commercial property, average price per square foot and more.

Rental Market Statistics 2024
With rental prices continuing to rise year-on-year, the industry poses many challenges for both tenants and property owners alike.

UK landlord insurance statistics 2024
With an estimated 2.8 million landlords in the UK, buy-to-let properties are a popular way of generating additional income and a financial investment for the future we look at landlord insurance statistics across the UK